Download this notebook from github.
Command line interface
xclim provides the xclim command line executable to perform basic indicator computation easily without having to start up a full python environment. However, not all indicators listed in Climate Indicators are available through this tool.
Its use is simple. Type the following to see the usage message:
[1]:
!xclim --help
Usage: xclim [OPTIONS] INDICATOR1 [OPTIONS] ... [INDICATOR2 [OPTIONS] ... ]
             ...

  Command line tool to compute indices on netCDF datasets. Indicators are
  referred to by their (case-insensitive) identifier, as in
  xclim.core.indicator.registry.

Options:
  -i, --input TEXT         Input files. Can be a netCDF path or a glob
                           pattern.
  -o, --output TEXT        Output filepath. A new file will be created
  -v, --verbose            Print details about context and progress.
  -V, --version            Prints xclim's version number and exits
  --dask-nthreads INTEGER  Start a dask.distributed Client with this many
                           threads and 1 worker. If not specified, the local
                           schedular is used. If specified, '--dask-maxmem'
                           must also be given
  --dask-maxmem TEXT       Memory limit for the dask.distributed Client as a
                           human readable string (ex: 4GB). If specified, '--
                           dask-nthreads' must also be specified.
  --chunks TEXT            Chunks to use when opening the input dataset(s).
                           Given as <dim1>:num,<dim2:num>. Ex:
                           time:365,lat:168,lon:150.
  --help                   Show this message and exit.

Commands:
  indices  List indicators.
  info     Give information about INDICATOR.
To list all available indicators, use the “indices” subcommand:
[2]:
!xclim indices
Listing all available indicators for computation.:
anuclim.p10_meantempwarmestquarter
Mean temperature values of the {op} quearter
of each year. (P10_MeanTempWarmestQuarter)
anuclim.p11_meantempcoldestquarter
Mean temperature values of the {op} quearter
of each year. (P11_MeanTempColdestQuarter)
anuclim.p12_annualprecip Annual precipitation (P12_AnnualPrecip)
anuclim.p13_precipwettestperiod
Total precipitation of the {op} period.
(P13_PrecipWettestPeriod)
anuclim.p14_precipdriestperiod Total precipitation of the {op} period.
(P14_PrecipDriestPeriod)
anuclim.p15_precipseasonality Precipitation coefficient of variation
(P15_PrecipSeasonality)
anuclim.p16_precipwettestquarter
Total precipitation values of the {op}
quarter of each year.
(P16_PrecipWettestQuarter)
anuclim.p17_precipdriestquarter
Total precipitation values of the {op}
quarter of each year.
(P17_PrecipDriestQuarter)
anuclim.p18_precipwarmestquarter
Total precipitation values of the {op}
quarter of each year
(P18_PrecipWarmestQuarter)
anuclim.p19_precipcoldestquarter
Total precipitation values of the {op}
quarter of each year
(P19_PrecipColdestQuarter)
anuclim.p1_annmeantemp Mean daily mean temperature (P1_AnnMeanTemp)
anuclim.p2_meandiurnalrange Mean Diurnal Temperature Range
(P2_MeanDiurnalRange)
anuclim.p3_isothermality Isothermality (P3_Isothermality)
anuclim.p4_tempseasonality Mean temperature coefficient of variation
(P4_TempSeasonality)
anuclim.p5_maxtempwarmestperiod
Max temperature of warmest period
(P5_MaxTempWarmestPeriod)
anuclim.p6_mintempcoldestperiod
Min temperature of coldest period
(P6_MinTempColdestPeriod)
anuclim.p7_tempannualrange Temperature annual range
(P7_TempAnnualRange)
anuclim.p8_meantempwettestquarter
Mean temperature values of the {op} quarter
of each year. (P8_MeanTempWettestQuarter)
anuclim.p9_meantempdriestquarter
Mean temperature values of the {op} quarter
of each year. (P9_MeanTempDriestQuarter)
base_flow_index Base flow index
biologically_effective_degree_days
Biologically effective degree days computed
with {method} formula (Summation of
min((max((Tmin + Tmax)/2 - {thresh_tasmin},
0) * k) + TR_adg, 9°C), for days between
{start_date} and {end_date}). (bedd)
blowing_snow Number of days where snowfall and wind
speeds are above respective thresholds.
({freq}_blowing_snow)
calm_days Number of days with surface wind speed below
threshold
cdd Maximum consecutive dry days (Precip <
{thresh})
cf.cdd Maximum consecutive dry days (Precip < 1mm)
(cdd)
cf.cddcoldtt Cooling Degree Days (Tmean > {threshold}C)
(cddcold{threshold})
cf.cfd Maximum number of consecutive frost days
(Tmin < 0 C) (cfd)
cf.csu Maximum number of consecutive summer days
(Tmax >25 C) (csu)
cf.ctmgett Maximum number of consequtive days with
Tmean >= {threshold}C (ctmge{threshold})
cf.ctmgttt Maximum number of consequtive days with
Tmean > {threshold}C (ctmgt{threshold})
cf.ctmlett Maximum number of consequtive days with
Tmean <= {threshold}C (ctmle{threshold})
cf.ctmlttt Maximum number of consequtive days with
Tmean < {threshold}C (ctmlt{threshold})
cf.ctngett Maximum number of consequtive days with Tmin
>= {threshold}C (ctnge{threshold})
cf.ctngttt Maximum number of consequtive days with Tmin
> {threshold}C (ctngt{threshold})
cf.ctnlett Maximum number of consequtive days with Tmin
<= {threshold}C (ctnle{threshold})
cf.ctnlttt Maximum number of consequtive days with Tmin
< {threshold}C (ctnlt{threshold})
cf.ctxgett Maximum number of consequtive days with Tmax
>= {threshold}C (ctxge{threshold})
cf.ctxgttt Maximum number of consequtive days with Tmax
> {threshold}C (ctxgt{threshold})
cf.ctxlett Maximum number of consequtive days with Tmax
<= {threshold}C (ctxle{threshold})
cf.ctxlttt Maximum number of consequtive days with Tmax
< {threshold}C (ctxlt{threshold})
cf.cwd Maximum consecutive wet days (Precip >= 1mm)
(cwd)
cf.ddgttt Degree Days (Tmean > {threshold}C)
(ddgt{threshold})
cf.ddlttt Degree Days (Tmean < {threshold}C)
(ddlt{threshold})
cf.dtr Mean Diurnal Temperature Range (dtr)
cf.etr Intra-period extreme temperature range (etr)
cf.fg Mean of daily mean wind strength (fg)
cf.fxx Maximum value of daily maximum wind gust
strength (fxx)
cf.gd4 Growing degree days (sum of Tmean > 4 C)
(gd4)
cf.gddgrow5 Annual Growing Degree Days (Tmean > 5C)
(gddgrow5)
cf.hd17 Heating degree days (sum of Tmean > 17 C)
(hd17)
cf.hddheattt Heating Degree Days (Tmean < {threshold}C)
(hddheat{threshold})
cf.pp Mean of daily sea level pressure (pp)
cf.rh Mean of daily relative humidity (rh)
cf.sd Mean of daily snow depth (sd)
cf.sdii Average precipitation during Wet Days (SDII)
(sdii)
cf.ss Sunshine duration, sum (ss)
cf.tg Mean of daily mean temperature (tg)
cf.tmm Mean daily mean temperature (tmm)
cf.tmmax Maximum daily mean temperature (tmmax)
cf.tmmean Mean daily mean temperature (tmmean)
cf.tmmin Minimum daily mean temperature (tmmin)
cf.tmn Minimum daily mean temperature (tmn)
cf.tmx Maximum daily mean temperature (tmx)
cf.tn Mean of daily minimum temperature (tn)
cf.tnm Mean daily minimum temperature (tnm)
cf.tnmax Maximum daily minimum temperature (tnmax)
cf.tnmean Mean daily minimum temperature (tnmean)
cf.tnmin Minimum daily minimum temperature (tnmin)
cf.tnn Minimum daily minimum temperature (tnn)
cf.tnx Maximum daily minimum temperature (tnx)
cf.tx Mean of daily maximum temperature (tx)
cf.txm Mean daily maximum temperature (txm)
cf.txmax Maximum daily maximum temperature (txmax)
cf.txmean Mean daily maximum temperature (txmean)
cf.txmin Minimum daily maximum temperature (txmin)
cf.txn Minimum daily maximum temperature (txn)
cf.txx Maximum daily maximum temperature (txx)
cf.vdtr Mean day-to-day variation in Diurnal
Temperature Range (vdtr)
cold_and_dry_days Cold and dry days
cold_and_wet_days cold and wet days
cold_spell_days Number of days part of a cold spell
cold_spell_duration_index Number of days part of a percentile-defined
cold spell (csdi_{window})
cold_spell_frequency Number of cold spell events
consecutive_frost_days Maximum number of consecutive days with Tmin
< {thresh}
consecutive_frost_free_days Maximum number of consecutive days with Tmin
> {thresh}
continuous_snow_cover_end Start date of continuous snow cover
continuous_snow_cover_start Start date of continuous snow cover
cool_night_index cool night index
cooling_degree_days Cooling Degree Days (Tmean > {thresh})
corn_heat_units Corn heat units (Tmin > {thresh_tasmin} and
Tmax > {thresh_tasmax}). (chu)
cwd Maximum consecutive wet days (Precip >=
{thresh})
days_over_precip_thresh Count of days with daily precipitation above
the given percentile [days].
days_with_snow Number of days with solid precipitation flux
between low and high thresholds.
dc Drought Code
degree_days_exceedance_date Day of year when cumulative degree days
exceed {sum_thresh}.
dlyfrzthw daily freezethaw cycles
doy_qmax Day of the year of the maximum over
{indexer} (q{indexer}_doy_qmax)
doy_qmin Day of the year of the minimum over
{indexer} (q{indexer}_doy_qmin)
dry_days Number of dry days (precip < {thresh})
dry_spell_frequency The {freq} number of dry periods of minimum
{window} days.
dry_spell_total_length The {freq} total number of days in dry
periods of minimum {window} days.
dtr Mean Diurnal Temperature Range
dtrmax Maximum Diurnal Temperature Range
dtrvar Mean Diurnal Temperature Range Variability
e_sat Saturation vapor pressure
effective_growing_degree_days Effective growing degree days computed with
{method} formula (Summation of max((Tmin +
Tmax)/2 - {thresh}, 0), for days between
between dynamically-determined start and end
dates). (egdd)
etr Intra-period Extreme Temperature Range
fire_season Fire season mask
first_day_above First day of year with temperature above
{thresh}
first_day_below First day of year with temperature below
{thresh}
first_snowfall Date of first snowfall
fit {dist} distribution parameters (params)
fraction_over_precip_thresh Fraction of precipitation over threshold
during wet days days.
freezethaw_spell_frequency {freq} number of freeze-thaw spells.
freezethaw_spell_max_length {freq} maximal length of freeze-thaw spells.
freezethaw_spell_mean_length {freq} average length of freeze-thaw spells.
freq_analysis N-year return period {mode} {indexer}
{window}-day flow
(q{window}{mode:r}{indexer})
freshet_start Day of year of spring freshet start
frost_days Number of Frost Days (Tmin < 0C)
frost_season_length Length of the frost season
fwi Drought Code, Duff Moisture Code, Fine Fuel
Moisture Code, Initial Spread Index, Buildup
Index, Fire Weather Index (dc, dmc, ffmc,
isi, bui, fwi)
growing_degree_days growing degree days above {thresh}
growing_season_end Day of year of growing season end
growing_season_length ETCCDI Growing Season Length (Tmean >
{thresh})
heat_wave_frequency Number of heat wave events (Tmin >
{thresh_tasmin} and Tmax > {thresh_tasmax}
for >= {window} days)
heat_wave_index Number of days that are part of a heatwave
heat_wave_max_length Maximum length of heat wave events (Tmin >
{thresh_tasmin}and Tmax > {thresh_tasmax}
for >= {window} days)
heat_wave_total_length Total length of heat wave events (Tmin >
{thresh_tasmin} and Tmax > {thresh_tasmax}
for >= {window} days)
heating_degree_days Heating Degree Days (Tmean < {thresh})
high_precip_low_temp Count of days with high precipitation and
low temperatures.
hot_spell_frequency Number of hot spell events (Tmax >
{thresh_tasmax} for >= {window} days)
hot_spell_max_length Maximum length of hot spell events (Tmax >
{thresh_tasmax} for >= {window} days)
huglin_index Huglin heliothermal index (Summation of
((Tmin + Tmax)/2 - {thresh_tasmin}) *
Latitude-based day-lengthcoefficient (`k`),
for days between {start_date} and
{end_date}). (hi)
humidex humidex index
hurs Relative Humidity
hurs_fromdewpoint Relative Humidity (hurs)
huss Specific Humidity
icclim.bedd Biologically effective growing degree days
(Summation of min((max((Tmin + Tmax)/2 -
{thresh_tasmin}, 0)), 9°C), for days between
1 April and 30 September) (BEDD)
icclim.cd Cold and dry days (CD)
icclim.cdd Maximum number of consecutive dry days (RR<1
mm) (CDD)
icclim.cfd Maximum number of consecutive frost days
(TN<0◦C) (CFD)
icclim.csdi Cold-spell duration index (CSDI)
icclim.csu Maximum number of consecutive summer day
(CSU)
icclim.cw cold and wet days (CW)
icclim.cwd Maximum number of consecutive wet days (RR≥1
mm) (CWD)
icclim.dtr Mean of diurnal temperature range (DTR)
icclim.etr Intra-period extreme temperature range (ETR)
icclim.fd Frost days (TN<0◦C) (FD)
icclim.gd4 Growing degree days (sum of TG>4◦C) (GD4)
icclim.gsl Growing season length (GSL)
icclim.hd17 Heating degree days (sum of17◦C - TG) (HD17)
icclim.hi Huglin heliothermal index (Summation of
((Tmin + Tmax)/2 - {thresh_tasmin}) *
Latitude-based day-length coefficient (`k`),
for days between 1 April and 31 October)
(HI)
icclim.id Ice days (TX<0◦C) (ID)
icclim.r10mm Number of wet days (precip >= {thresh})
(R10mm)
icclim.r20mm Very heavy precipitation days
(precipitation≥20 mm) (R20mm)
icclim.r75p Count of days with daily precipitation above
the given percentile [days]. (R75p)
icclim.r75ptot Precipitation fraction due to moderate wet
days (>75th percentile) (R75pTOT)
icclim.r95p Count of days with daily precipitation above
the given percentile [days]. (R95p)
icclim.r95ptot Precipitation fraction due to very wet days
(>95th percentile) (R95pTOT)
icclim.r99p Count of days with daily precipitation above
the given percentile [days]. (R99p)
icclim.r99ptot Precipitation fraction due to extremely wet
days (>99th percentile) (R99pTOT)
icclim.rr Precipitation sum (RR)
icclim.rr1 Wet days (RR≥1 mm) (RR1)
icclim.rx1day Highest 1-day precipitation amount (RX1day)
icclim.rx5day Highest 5-day precipitation amount (RX5day)
icclim.sd Mean of daily snow depth (SD)
icclim.sd1 Snow days (SD≥1 cm) (SD1)
icclim.sd50cm Snow days (SD≥50 cm) (SD50cm)
icclim.sd5cm Snow days (SD≥5 cm) (SD5cm)
icclim.sdii Average precipitation during wet days (SDII)
(SDII)
icclim.su Summer days (TX>25◦C) (SU)
icclim.tg Mean daily mean temperature (TG)
icclim.tg10p Days with TG<10th percentile of daily mean
temperature (cold days) (TG10p)
icclim.tg90p Days with TG>90th percentile of daily mean
temperature (warm days) (TG90p)
icclim.tgn Minimum daily mean temperature (TGn)
icclim.tgx Maximum daily mean temperature (TGx)
icclim.tn Mean daily minimum temperature (TN)
icclim.tn10p Days with TN<10th percentile of daily
minimum temperature (cold nights) (TN10p)
icclim.tn90p Days with TN>90th percentile of daily
minimum temperature (warm nights) (TN90p)
icclim.tnn Minimum daily minimum temperature (TNn)
icclim.tnx Maximum daily minimum temperature (TNx)
icclim.tr Tropical nights (TN>20◦C) (TR)
icclim.tx Mean daily maximum temperature (TX)
icclim.tx10p Days with TX<10th percentile of daily
maximum temperature (cold day-times) (TX10p)
icclim.tx90p Number of days when Tmax > 90th percentile
(TX90p)
icclim.txn Minimum daily maximum temperature (TXn)
icclim.txx Maximum daily maximum temperature (TXx)
icclim.vdtr Mean absolute day-to-day difference in DTR
(vDTR)
icclim.wd Warm and dry days (WD)
icclim.wsdi Warm-spell duration index (WSDI)
icclim.ww Warm and wet days (WW)
ice_days Number of Ice Days (Tmax < 0℃)
last_snowfall Date of last snowfall
last_spring_frost Day of year of last spring frost
latitude_temperature_index Latitude-temperature index (lti)
liquid_precip_ratio Ratio of rainfall to total precipitation.
liquidprcptot Total liquid precipitation
max_n_day_precipitation_amount maximum {window}-day total precipitation
(rx{window}day)
max_pr_intensity Maximum precipitation intensity over
{window}h duration
maximum_consecutive_warm_days The maximum number of days with tasmax >
thresh per periods (summer days).
melt_and_precip_max The maximum snow melt plus precipitation
over a given number of days for each period.
[mass/area]. ({freq}_melt_and_precip_max)
potential_evapotranspiration Potential evapotranspiration (evspsblpot)
prcptot Total precipitation
prlp Liquid precipitation
prsn Solid precipitation
rain_frzgr Number of rain on frozen ground days
rb_flashiness_index Richards-Baker flashiness index (rbi)
rx1day maximum 1-day total precipitation
sdii Average precipitation during wet days (SDII)
sea_ice_area Sea ice area
sea_ice_extent Sea ice extent
snd_max_doy Date when snow depth reaches its maximum
value. ({freq}_snd_max_doy)
snow_cover_duration Number of days with snow depth above
threshold
snow_depth Mean of daily snow depth
snow_melt_we_max The maximum snow melt over a given number of
days for each period. [mass/area].
({freq}_snow_melt_we_max)
solidprcptot Total solid precipitation
stats {freq} {op} of {indexer} daily flow
(q{indexer}{op:r})
tg Daily mean temperature
tg10p Number of days when Tmean < 10th percentile
tg90p Number of days when Tmean > 90th percentile
tg_days_above Number of days with Tavg > {thresh}
tg_days_below Number of days with Tavg < {thresh}
tg_max Maximum daily mean temperature
tg_mean Mean daily mean temperature
tg_min Minimum daily mean temperature
tn10p Number of days when Tmin < 10th percentile
tn90p Number of days when Tmin > 90th percentile
tn_days_above Number of days with Tmin > {thresh}
tn_days_below Number of days with Tmin < {thresh}
tn_max Maximum daily minimum temperature
tn_mean Mean daily minimum temperature
tn_min Minimum daily minimum temperature
tropical_nights Number of Tropical Nights (Tmin > {thresh})
tx10p Number of days when Tmax < 10th percentile
tx90p Number of days when Tmax > 90th percentile
tx_days_above Number of days with Tmax > {thresh}
tx_days_below Number of days with Tmax < {thresh}
tx_max Maximum daily maximum temperature
tx_mean Mean daily maximum temperature
tx_min Minimum daily maximum temperature
tx_tn_days_above Number of days with Tmax > {thresh_tasmax}
and Tmin > {thresh_tasmin}
warm_and_dry_days warm and dry days
warm_and_wet_days warm and wet days
warm_spell_duration_index Warm spell duration index.
water_budget Water budget
wetdays Number of wet days (precip >= {thresh})
wind_chill Wind chill index
wind_speed_from_vector Near-Surface Wind Speed, Near-Surface Wind
from Direction (sfcWind, sfcWindfromdir)
wind_vector_from_speed Near-Surface Eastward Wind, Near-Surface
Northward Wind (uas, vas)
windy_days Number of days with surface wind speed above
threshold
winter_storm Number of days per period identified as
winter storms. ({freq}_winter_storm)
For more information about a specific indicator, you can either use the info subcommand or directly access the --help message of the indicator. The former gives more information about the metadata while the latter only prints the usage. Note that the module name (atmos, land or seaIce) is mandatory.
[3]:
!xclim info liquidprcptot
Indicator liquidprcptot:
    identifier : liquidprcptot
    title : Accumulated liquid precipitation.
    abstract : Resample the original daily mean precipitation flux
  and accumulate over each period. If a daily temperature is provided, the
  `phase` keyword can be used to sum precipitation of a given phase only. When
  the temperature is under the provided threshold, precipitation is assumed to
  be snow, and liquid rain otherwise. This indice is agnostic to the type of
  daily temperature (tas, tasmax or tasmin) given.
    keywords :
    outputs (#1)
      var_name : liquidprcptot
      standard_name : lwe_thickness_of_liquid_precipitation_amount
      long_name : Total liquid precipitation
      units : mm
      cell_methods : time: sum within days time: sum over days
      description : Annual total liquid precipitation, estimated as
  precipitation when temperature >= 0 degc
    notes : Let :math:`PR_i` be the mean daily precipitation of day
  :math:`i`, then for a period :math:`j` starting at day :math:`a` and
  finishing on day :math:`b`:

  .. math::

     PR_{ij} = \sum_{i=a}^{b} PR_i

  If tas and phase are given, the corresponding phase precipitation is
  estimated before computing the accumulation, using one of
  `snowfall_approximation` or `rain_approximation` with the `binary` method.

Options:
  --pr VAR_NAME   Mean daily precipitation flux.  [default: pr]
  --tas VAR_NAME  Mean, maximum or minimum daily temperature.  [default: tas]
  --thresh TEXT   Threshold of `tas` over which the precipication is assumed
                  to be liquid rain.  [default: 0 degC]
  --freq TEXT     Resampling frequency.  [default: YS]
  --help          Show this message and exit.
In the usage message, VAR_NAME indicates that the passed argument must match a variable in the input dataset.
[4]:
import xarray as xr
import numpy as np
import pandas as pd
from pandas.plotting import register_matplotlib_converters
register_matplotlib_converters()
import warnings
warnings.filterwarnings('ignore', 'implicitly registered datetime converter')
%matplotlib inline
xr.set_options(display_style='html')

time = pd.date_range('2000-01-01', periods=366)
tasmin = xr.DataArray(-5 * np.cos(2 * np.pi * time.dayofyear / 365) + 273.15, dims=("time"),
                      coords={'time': time}, attrs={'units':'K'})
tasmax = xr.DataArray(-5 * np.cos(2 * np.pi * time.dayofyear / 365) + 283.15, dims=("time"),
                      coords={'time': time}, attrs={'units':'K'})
pr = xr.DataArray(np.clip(10 * np.sin(18 * np.pi * time.dayofyear / 365), 0, None), dims=("time"),
                      coords={'time': time}, attrs={'units':'mm/d'})
ds = xr.Dataset({'tasmin': tasmin, 'tasmax': tasmax, 'pr': pr})
ds.to_netcdf('example_data.nc')
Computing indicators
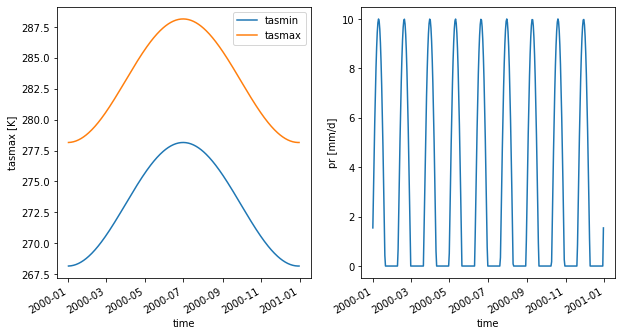
So let’s say we have the following toy dataset:
[5]:
import xarray as xr
ds = xr.open_dataset('example_data.nc')
ds
[5]:
<xarray.Dataset>
Dimensions:  (time: 366)
Coordinates:
  * time     (time) datetime64[ns] 2000-01-01 2000-01-02 ... 2000-12-31
Data variables:
    tasmin   (time) float64 268.2 268.2 268.2 268.2 ... 268.2 268.2 268.1 268.2
    tasmax   (time) float64 278.2 278.2 278.2 278.2 ... 278.2 278.2 278.1 278.2
pr (time) float64 1.543 3.049 4.482 5.808 6.995 ... 0.0 0.0 0.0 1.543[6]:
import matplotlib.pyplot as plt
fig, (axT, axpr) = plt.subplots(1, 2, figsize=(10, 5))
ds.tasmin.plot(label='tasmin', ax=axT)
ds.tasmax.plot(label='tasmax', ax=axT)
ds.pr.plot(ax=axpr)
axT.legend()
[6]:
<matplotlib.legend.Legend at 0x7fe8e7225250>
To compute an indicator, say the monthly solid precipitation accumulation, we simply call:
[7]:
!xclim -i example_data.nc -o out1.nc solidprcptot --pr pr --tas tasmin --freq MS
/home/docs/checkouts/readthedocs.org/user_builds/xclim/envs/v0.29.0/lib/python3.7/site-packages/xclim/core/cfchecks.py:40: UserWarning: Variable does not have a `cell_methods` attribute.
  vardata, "cell_methods", parse_cell_methods(data["cell_methods"]) + "*"
/home/docs/checkouts/readthedocs.org/user_builds/xclim/envs/v0.29.0/lib/python3.7/site-packages/xclim/core/cfchecks.py:43: UserWarning: Variable does not have a `standard_name` attribute.
  check_valid(vardata, "standard_name", data["standard_name"])
/home/docs/checkouts/readthedocs.org/user_builds/xclim/envs/v0.29.0/lib/python3.7/site-packages/xclim/indicators/atmos/_precip.py:51: UserWarning: Variable does not have a `standard_name` attribute.
  cfchecks.check_valid(tas, "standard_name", "air_temperature")
[########################################] | 100% Completed |  0.1s
In this example, we decided to use tasmin for the tas variable. We didn’t need to provide the --pr parameter as our data has the same name.
Finally, more than one indicators can be computed to the output dataset by simply chaining the calls:
[8]:
!xclim -i example_data.nc -o out2.nc liquidprcptot --tas tasmin --freq MS tropical_nights --thresh "2 degC" --freq MS
/home/docs/checkouts/readthedocs.org/user_builds/xclim/envs/v0.29.0/lib/python3.7/site-packages/xclim/core/cfchecks.py:40: UserWarning: Variable does not have a `cell_methods` attribute.
  vardata, "cell_methods", parse_cell_methods(data["cell_methods"]) + "*"
/home/docs/checkouts/readthedocs.org/user_builds/xclim/envs/v0.29.0/lib/python3.7/site-packages/xclim/core/cfchecks.py:43: UserWarning: Variable does not have a `standard_name` attribute.
  check_valid(vardata, "standard_name", data["standard_name"])
/home/docs/checkouts/readthedocs.org/user_builds/xclim/envs/v0.29.0/lib/python3.7/site-packages/xclim/indicators/atmos/_precip.py:51: UserWarning: Variable does not have a `standard_name` attribute.
  cfchecks.check_valid(tas, "standard_name", "air_temperature")
/home/docs/checkouts/readthedocs.org/user_builds/xclim/envs/v0.29.0/lib/python3.7/site-packages/xclim/core/cfchecks.py:40: UserWarning: Variable does not have a `cell_methods` attribute.
  vardata, "cell_methods", parse_cell_methods(data["cell_methods"]) + "*"
/home/docs/checkouts/readthedocs.org/user_builds/xclim/envs/v0.29.0/lib/python3.7/site-packages/xclim/core/cfchecks.py:43: UserWarning: Variable does not have a `standard_name` attribute.
  check_valid(vardata, "standard_name", data["standard_name"])
[########################################] | 100% Completed |  0.1s
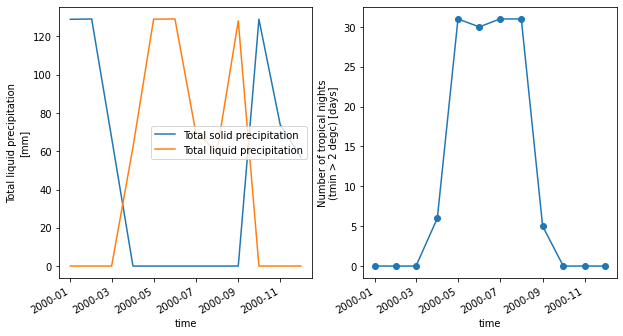
Let’s see the outputs:
[9]:
ds1 = xr.open_dataset('out1.nc')
ds2 = xr.open_dataset('out2.nc', decode_timedelta=False)

fig, (axPr, axTn) = plt.subplots(1, 2, figsize=(10, 5))
ds1.solidprcptot.plot(ax=axPr, label=ds1.solidprcptot.long_name)
ds2.liquidprcptot.plot(ax=axPr, label=ds2.liquidprcptot.long_name)
ds2.tropical_nights.plot(ax=axTn, marker='o')
axPr.legend()
[9]:
<matplotlib.legend.Legend at 0x7fe8e2fb5510>
[10]:
ds1.close()
[11]:
ds2.close()