Download this notebook from github.
Command Line Interface
xclim provides the xclim command line executable to perform basic indicator computation easily without having to start up a full Python environment. However, not all indicators listed in Climate Indicators are available through this tool.
Its use is simple; Type the following to see the usage message:
[2]:
!xclim --help
Usage: xclim [OPTIONS] INDICATOR1 [OPTIONS] ... [INDICATOR2 [OPTIONS] ... ]
             ...

  Command line tool to compute indices on netCDF datasets. Indicators are
  referred to by their (case-insensitive) identifier, as in
  xclim.core.indicator.registry.

Options:
  -i, --input TEXT         Input files. Can be a netCDF path or a glob
                           pattern.
  -o, --output TEXT        Output filepath. A new file will be created
  -v, --verbose            Print details about context and progress.
  -V, --version            Prints xclim's version number and exits
  --dask-nthreads INTEGER  Start a dask.distributed Client with this many
                           threads and 1 worker. If not specified, the local
                           scheduler is used. If specified, '--dask-maxmem'
                           must also be given
  --dask-maxmem TEXT       Memory limit for the dask.distributed Client as a
                           human readable string (ex: 4GB). If specified, '--
                           dask-nthreads' must also be specified.
  --chunks TEXT            Chunks to use when opening the input dataset(s).
                           Given as <dim1>:num,<dim2:num>. Ex:
                           time:365,lat:168,lon:150.
  --help                   Show this message and exit.

Commands:
  indices            List indicators.
  info               Give information about INDICATOR.
  dataflags          Run data flag checks for input variables.
  release_notes      Print history for publishing purposes.
  show_version_info  Print versions of dependencies for debugging purposes.
To list all available indicators, use the “indices” subcommand:
[3]:
!xclim indices
Listing all available indicators for computation.:
anuclim.p10_meantempwarmestquarter
P10_MeanTempWarmestQuarter
(P10_MeanTempWarmestQuarter)
anuclim.p11_meantempcoldestquarter
P11_MeanTempColdestQuarter
(P11_MeanTempColdestQuarter)
anuclim.p12_annualprecip Annual Precipitation (P12_AnnualPrecip)
anuclim.p13_precipwettestperiod
P13_PrecipWettestPeriod
(P13_PrecipWettestPeriod)
anuclim.p14_precipdriestperiod P14_PrecipDriestPeriod
(P14_PrecipDriestPeriod)
anuclim.p15_precipseasonality P15_PrecipSeasonality
(P15_PrecipSeasonality)
anuclim.p16_precipwettestquarter
P16_PrecipWettestQuarter
(P16_PrecipWettestQuarter)
anuclim.p17_precipdriestquarter
P17_PrecipDriestQuarter
(P17_PrecipDriestQuarter)
anuclim.p18_precipwarmestquarter
P18_PrecipWarmestQuarter
(P18_PrecipWarmestQuarter)
anuclim.p19_precipcoldestquarter
P19_PrecipColdestQuarter
(P19_PrecipColdestQuarter)
anuclim.p1_annmeantemp Annual Mean Temperature (P1_AnnMeanTemp)
anuclim.p2_meandiurnalrange Mean Diurnal Range (P2_MeanDiurnalRange)
anuclim.p3_isothermality P3_Isothermality (P3_Isothermality)
anuclim.p4_tempseasonality P4_TempSeasonality (P4_TempSeasonality)
anuclim.p5_maxtempwarmestperiod
Max Temperature of Warmest Period
(P5_MaxTempWarmestPeriod)
anuclim.p6_mintempcoldestperiod
Min Temperature of Coldest Period
(P6_MinTempColdestPeriod)
anuclim.p7_tempannualrange Temperature Annual Range
(P7_TempAnnualRange)
anuclim.p8_meantempwettestquarter
P8_MeanTempWettestQuarter
(P8_MeanTempWettestQuarter)
anuclim.p9_meantempdriestquarter
P9_MeanTempDriestQuarter
(P9_MeanTempDriestQuarter)
australian_hardiness_zones Hardiness zones (hz)
base_flow_index Base flow index
biologically_effective_degree_days
Integral of mean daily temperature above
{thresh_tasmin}, with maximum value of
{max_daily_degree_days}, multiplied by day-
length coefficient and temperature range
modifier based on {method} method for days
between {start_date} and {end_date} (bedd)
blowing_snow Days with snowfall and wind speed at or
above given thresholds ({freq}_blowing_snow)
calm_days Number of days with surface wind speed below
{thresh}
cdd Maximum consecutive days with daily
precipitation below {thresh}
cf.cdd Maximum consecutive dry days (Precip < 1mm)
(cdd)
cf.cddcoldtt Cooling Degree Days (Tmean > {threshold}C)
(cddcold{threshold})
cf.cfd Maximum number of consecutive frost days
(Tmin < 0 C) (cfd)
cf.csu Maximum number of consecutive summer days
(Tmax >25 C) (csu)
cf.ctmgett Maximum number of consecutive days with
Tmean >= {threshold}C (ctmge{threshold})
cf.ctmgttt Maximum number of consecutive days with
Tmean > {threshold}C (ctmgt{threshold})
cf.ctmlett Maximum number of consecutive days with
Tmean <= {threshold}C (ctmle{threshold})
cf.ctmlttt Maximum number of consecutive days with
Tmean < {threshold}C (ctmlt{threshold})
cf.ctngett Maximum number of consecutive days with Tmin
>= {threshold}C (ctnge{threshold})
cf.ctngttt Maximum number of consecutive days with Tmin
> {threshold}C (ctngt{threshold})
cf.ctnlett Maximum number of consecutive days with Tmin
<= {threshold}C (ctnle{threshold})
cf.ctnlttt Maximum number of consecutive days with Tmin
< {threshold}C (ctnlt{threshold})
cf.ctxgett Maximum number of consecutive days with Tmax
>= {threshold}C (ctxge{threshold})
cf.ctxgttt Maximum number of consecutive days with Tmax
> {threshold}C (ctxgt{threshold})
cf.ctxlett Maximum number of consecutive days with Tmax
<= {threshold}C (ctxle{threshold})
cf.ctxlttt Maximum number of consecutive days with Tmax
< {threshold}C (ctxlt{threshold})
cf.cwd Maximum consecutive wet days (Precip >= 1mm)
(cwd)
cf.ddgttt Degree Days (Tmean > {threshold}C)
(ddgt{threshold})
cf.ddlttt Degree Days (Tmean < {threshold}C)
(ddlt{threshold})
cf.dtr Mean Diurnal Temperature Range (dtr)
cf.etr Intra-period extreme temperature range (etr)
cf.fg Mean of daily mean wind strength (fg)
cf.fxx Maximum value of daily maximum wind gust
strength (fxx)
cf.gd4 Growing degree days (sum of Tmean > 4 C)
(gd4)
cf.gddgrowtt Annual Growing Degree Days (Tmean >
{threshold}C) (gddgrow{threshold})
cf.hd17 Heating degree days (sum of Tmean < 17 C)
(hd17)
cf.hddheattt Heating Degree Days (Tmean < {threshold}C)
(hddheat{threshold})
cf.maxdtr Maximum Diurnal Temperature Range (maxdtr)
cf.pp Mean of daily sea level pressure (pp)
cf.rh Mean of daily relative humidity (rh)
cf.sd Mean of daily snow depth (sd)
cf.sdii Average precipitation during Wet Days (SDII)
(sdii)
cf.ss Sunshine duration, sum (ss)
cf.tg Mean of daily mean temperature (tg)
cf.tmm Mean daily mean temperature (tmm)
cf.tmmax Maximum daily mean temperature (tmmax)
cf.tmmean Mean daily mean temperature (tmmean)
cf.tmmin Minimum daily mean temperature (tmmin)
cf.tmn Minimum daily mean temperature (tmn)
cf.tmx Maximum daily mean temperature (tmx)
cf.tn Mean of daily minimum temperature (tn)
cf.tnm Mean daily minimum temperature (tnm)
cf.tnmax Maximum daily minimum temperature (tnmax)
cf.tnmean Mean daily minimum temperature (tnmean)
cf.tnmin Minimum daily minimum temperature (tnmin)
cf.tnn Minimum daily minimum temperature (tnn)
cf.tnx Maximum daily minimum temperature (tnx)
cf.tx Mean of daily maximum temperature (tx)
cf.txm Mean daily maximum temperature (txm)
cf.txmax Maximum daily maximum temperature (txmax)
cf.txmean Mean daily maximum temperature (txmean)
cf.txmin Minimum daily maximum temperature (txmin)
cf.txn Minimum daily maximum temperature (txn)
cf.txx Maximum daily maximum temperature (txx)
cf.vdtr Mean day-to-day variation in Diurnal
Temperature Range (vdtr)
cffwis Drought Code, Duff Moisture Code, Fine Fuel
Moisture Code, Initial Spread Index, Buildup
Index, Fire Weather Index (dc, dmc, ffmc,
isi, bui, fwi)
cold_and_dry_days Number of days where temperature is below
{tas_per_thresh}th percentile and
precipitation is below {pr_per_thresh}th
percentile
cold_and_wet_days Number of days where temperature is below
{tas_per_thresh}th percentile and
precipitation is above {pr_per_thresh}th
percentile
cold_spell_days Total number of days constituting events of
at least {window} consecutive days where the
mean daily temperature is below {thresh}
cold_spell_duration_index Total number of days constituting events of
at least {window} consecutive days where the
daily minimum temperature is below the
{tasmin_per_thresh}th percentile
(csdi_{window})
cold_spell_frequency Number of cold periods of {window} day(s) or
more, during which the temperature on a
window of {window} day(s) is below {thresh}.
cold_spell_max_length Maximum consecutive number of days in a cold
period of {window} day(s) or more, during
which the temperature within windows of
{window} day(s) is under {thresh}.
cold_spell_total_length Number of days in cold periods of {window}
day(s) or more, during which thetemperature
within windows of {window} day(s) is under
{thresh}.
consecutive_frost_days Maximum number of consecutive days where
minimum daily temperature is below {thresh}
consecutive_frost_free_days Maximum number of consecutive days with
minimum temperature at or above {thresh}
cool_night_index Mean minimum temperature in late summer
cooling_degree_days Cumulative sum of temperature degrees for
mean daily temperature above {thresh}
corn_heat_units Corn heat units (Tmin > {thresh_tasmin} and
Tmax > {thresh_tasmax}) (chu)
cwd Maximum consecutive days with daily
precipitation at or above {thresh}
days_over_precip_doy_thresh Number of days with daily precipitation flux
above the {pr_per_thresh}th percentile of
{pr_per_period}
days_over_precip_thresh Number of days with precipitation flux above
the {pr_per_thresh}th percentile of
{pr_per_period}
days_with_snow Number of days with snowfall between {low}
and {high} thresholds
dc Drought Code
degree_days_exceedance_date Day of year when the integral of mean daily
temperature {op} {thresh} exceeds
{sum_thresh}
df Griffiths Drought Factor
dlyfrzthw Number of days where maximum daily
temperatures are above {thresh_tasmax} and
minimum daily temperatures are at or below
{thresh_tasmin}
doy_qmax Day of the year of the maximum streamflow
over {indexer} (q{indexer}_doy_qmax)
doy_qmin Day of the year of the minimum streamflow
over {indexer} (q{indexer}_doy_qmin)
dry_days Number of dry days
dry_spell_frequency Number of dry periods of {window} day(s) or
more, during which the {op} precipitation on
a window of {window} day(s) is below
{thresh}.
dry_spell_max_length Maximum consecutive number of days in a dry
period of {window} day(s) or more, during
which the {op} precipitation within windows
of {window} day(s) is under {thresh}.
dry_spell_total_length Number of days in dry periods of {window}
day(s) or more, during which the {op}
precipitation within windows of {window}
day(s) is under {thresh}.
dryness_index Growing season humidity
dtr Mean diurnal temperature range
dtrmax Maximum diurnal temperature range
dtrvar Mean diurnal temperature range variability
e_sat Saturation vapour pressure ("{method}"
method)
effective_growing_degree_days Integral of mean daily temperature above
{thresh} for days between start and end
dates dynamically determined using {method}
method (egdd)
etr Intra-period extreme temperature range
ffdi McArthur Forest Fire Danger Index
fire_season Fire season mask
first_day_tg_above First day of year with a period of at least
{window} days of mean temperature above
{thresh}
first_day_tg_below First day of year with a period of at least
{window} days of mean temperature below
{thresh}
first_day_tn_above First day of year with a period of at least
{window} days of minimum temperature above
{thresh}
first_day_tn_below First day of year with a period of at least
{window} days of minimum temperature below
{thresh}
first_day_tx_above First day of year with a period of at least
{window} days of maximum temperature above
{thresh}
first_day_tx_below First day of year with a period of at least
{window} days of maximum temperature below
{thresh}
first_snowfall Date of first day where snowfall exceeded
{thresh}
fit {dist} distribution parameters (params)
fraction_over_precip_doy_thresh
Fraction of precipitation due to days with
daily precipitation above {pr_per_thresh}th
daily percentile
fraction_over_precip_thresh Fraction of precipitation due to days with
precipitation above {pr_per_thresh}th daily
percentile
freezethaw_spell_frequency Frequency of events where maximum daily
temperatures are above {thresh_tasmax} and
minimum daily temperatures are at or below
{thresh_tasmin} for at least {window}
consecutive day(s).
freezethaw_spell_max_length Maximal length of events where maximum daily
temperatures are above {thresh_tasmax} and
minimum daily temperatures are at or below
{thresh_tasmin} for at least {window}
consecutive day(s).
freezethaw_spell_mean_length Average length of events where maximum daily
temperatures are above {thresh_tasmax} and
minimum daily temperatures are at or below
{thresh_tasmin} for at least {window}
consecutive day(s).
freezing_degree_days Cumulative sum of temperature degrees for
mean daily temperature below {thresh}
freshet_start First day where temperature threshold of
{thresh} is exceeded for at least {window}
days
frost_days Number of days where the daily minimum
temperature is below {thresh}
frost_free_season_end First day, after {mid_date}, following a
period of {window} days with minimum daily
temperature below {thresh}
frost_free_season_length Number of days between the first occurrence
of at least {window} consecutive days with
minimum daily temperature at or above
{thresh} and the first occurrence of at
least {window} consecutive days with minimum
daily temperature below {thresh} after
{mid_date}
frost_free_season_start First day following a period of {window}
days with minimum daily temperature at or
above {thresh}
frost_free_spell_max_length Maximum consecutive number of days in a
frost free period of {window} day(s) or
more, during which the minimum temperature
within windows of {window} day(s) is above
{thresh}.
frost_season_length Number of days between the first occurrence
of at least {window} consecutive days with
minimum daily temperature below {thresh} and
the first occurrence of at least {window}
consecutive days with minimum daily
temperature at or above {thresh} after
{mid_date}
growing_degree_days Cumulative sum of temperature degrees for
mean daily temperature above {thresh}
growing_season_end First day of the first series of {window}
days with mean daily temperature below
{thresh}, occurring after {mid_date}
growing_season_length Number of days between the first occurrence
of at least {window} consecutive days with
mean daily temperature over {thresh} and the
first occurrence of at least {window}
consecutive days with mean daily temperature
below {thresh}, occurring after {mid_date}
growing_season_start First day of the first series of {window}
days with mean daily temperature above or
equal to {thresh}
heat_index Heat index
heat_wave_frequency Total number of series of at least {window}
consecutive days with daily minimum
temperature above {thresh_tasmin} and daily
maximum temperature above {thresh_tasmax}
heat_wave_index Total number of days constituting events of
at least {window} consecutive days with
daily maximum temperature above {thresh}
heat_wave_max_length Longest series of at least {window}
consecutive days with daily minimum
temperature above {thresh_tasmin} and daily
maximum temperature above {thresh_tasmax}
heat_wave_total_length Total length of events of at least {window}
consecutive days with daily minimum
temperature above {thresh_tasmin} and daily
maximum temperature above {thresh_tasmax}
heating_degree_days Cumulative sum of temperature degrees for
mean daily temperature below {thresh}
high_precip_low_temp Days with precipitation at or above
{pr_thresh} and temperature below
{tas_thresh}
hot_spell_frequency Number of hot periods of {window} day(s) or
more, during which the temperature on a
window of {window} day(s) is above {thresh}.
hot_spell_max_length Maximum consecutive number of days in a hot
period of {window} day(s) or more, during
which the temperature within windows of
{window} day(s) is above {thresh}.
hot_spell_total_length Number of days in hot periods of {window}
day(s) or more, during which thetemperature
within windows of {window} day(s) is above
{thresh}.
huglin_index Integral of mean daily temperature above
{thresh} multiplied by day-length
coefficient with {method} method for days
between {start_date} and {end_date} (hi)
humidex Humidex index
hurs Relative Humidity ("{method}" method)
hurs_fromdewpoint Relative humidity ("{method}" method) (hurs)
huss Specific Humidity ("{method}" method)
huss_fromdewpoint Specific humidity ("{method}" method)
icclim.bedd Biologically effective growing degree days
(Summation of min(max((Tmin + Tmax)/2 -
10°C, 0), 9°C), for days between 1 April and
30 September) (BEDD)
icclim.cd Cold and dry days (CD)
icclim.cdd Maximum number of consecutive dry days (RR<1
mm) (CDD)
icclim.cfd Maximum number of consecutive frost days
(TN<0°C) (CFD)
icclim.csdi Cold-spell duration index (CSDI)
icclim.csu Maximum number of consecutive summer day
(CSU)
icclim.cw cold and wet days (CW)
icclim.cwd Maximum number of consecutive wet days (RR≥1
mm) (CWD)
icclim.dtr Mean of diurnal temperature range (DTR)
icclim.etr Intra-period extreme temperature range (ETR)
icclim.fd Frost days (TN<0°C) (FD)
icclim.gd4 Growing degree days (sum of TG>4°C) (GD4)
icclim.gsl Growing season length (GSL)
icclim.hd17 Heating degree days (sum of17°C - TG) (HD17)
icclim.hi Huglin heliothermal index (Summation of
((Tmean + Tmax)/2 - 10°C) * Latitude-based
day-length coefficient (`k`), for days
between 1 April and 31 October) (HI)
icclim.id Ice days (TX<0°C) (ID)
icclim.prcptot Precipitation sum over wet days (PRCPTOT)
icclim.r10mm Heavy precipitation days (precipitation≥10
mm) (R10mm)
icclim.r20mm Very heavy precipitation days
(precipitation≥20 mm) (R20mm)
icclim.r75p Number of days with precipitation flux above
the {pr_per_thresh}th percentile of
{pr_per_period} (R75p)
icclim.r75ptot Precipitation fraction due to moderate wet
days (>75th percentile) (R75pTOT)
icclim.r95p Number of days with precipitation flux above
the {pr_per_thresh}th percentile of
{pr_per_period} (R95p)
icclim.r95ptot Precipitation fraction due to very wet days
(>95th percentile) (R95pTOT)
icclim.r99p Number of days with precipitation flux above
the {pr_per_thresh}th percentile of
{pr_per_period} (R99p)
icclim.r99ptot Precipitation fraction due to extremely wet
days (>99th percentile) (R99pTOT)
icclim.rr Precipitation sum (RR)
icclim.rr1 Wet days (RR≥1 mm) (RR1)
icclim.rx1day Highest 1-day precipitation amount (RX1day)
icclim.rx5day Highest 5-day precipitation amount (RX5day)
icclim.sd Mean of daily snow depth (SD)
icclim.sd1 Snow days (SD≥1 cm) (SD1)
icclim.sd50cm Snow days (SD≥50 cm) (SD50cm)
icclim.sd5cm Snow days (SD≥5 cm) (SD5cm)
icclim.sdii Average precipitation during days with daily
precipitation over {thresh} (Simple Daily
Intensity Index: SDII) (SDII)
icclim.su Summer days (TX>25°C) (SU)
icclim.tg Mean daily mean temperature (TG)
icclim.tg10p Days with TG<10th percentile of daily mean
temperature (cold days) (TG10p)
icclim.tg90p Days with TG>90th percentile of daily mean
temperature (warm days) (TG90p)
icclim.tgn Minimum daily mean temperature (TGn)
icclim.tgx Maximum daily mean temperature (TGx)
icclim.tn Mean daily minimum temperature (TN)
icclim.tn10p Days with TN<10th percentile of daily
minimum temperature (cold nights) (TN10p)
icclim.tn90p Days with TN>90th percentile of daily
minimum temperature (warm nights) (TN90p)
icclim.tnn Minimum daily minimum temperature (TNn)
icclim.tnx Maximum daily minimum temperature (TNx)
icclim.tr Tropical nights (TN>20°C) (TR)
icclim.tx Mean daily maximum temperature (TX)
icclim.tx10p Days with TX<10th percentile of daily
maximum temperature (cold day-times) (TX10p)
icclim.tx90p Days with TX>90th percentile of daily
maximum temperature (warm day-times) (TX90p)
icclim.txn Minimum daily maximum temperature (TXn)
icclim.txx Maximum daily maximum temperature (TXx)
icclim.vdtr Mean absolute day-to-day difference in DTR
(vDTR)
icclim.wd Warm and dry days (WD)
icclim.wsdi Warm-spell duration index (WSDI)
icclim.ww Warm and wet days (WW)
ice_days Number of days with maximum daily
temperature below {thresh}
jetstream_metric_woollings Latitude of maximum smoothed zonal wind
speed, Maximum strength of smoothed zonal
wind speed (jetlat, jetstr)
kbdi Keetch-Byran Drought Index
last_snowfall Date of last day where snowfall exceeded
{thresh}
last_spring_frost Last day of minimum daily temperature below
a threshold of {thresh} for at least
{window} days before a given date
({before_date})
late_frost_days Number of days where the daily minimum
temperature is below {thresh}
latitude_temperature_index Mean temperature of warmest month multiplied
by the difference of {lat_factor} minus
latitude (lti)
liquid_precip_ratio Fraction of liquid to total precipitation
(temperature above {thresh})
liquidprcpavg Averaged precipitation when temperature is
above {thresh}
liquidprcptot Total accumulated precipitation when
temperature is above {thresh}
longwave_upwelling_radiation_from_net_downwelling
Upwelling longwave flux (rlus)
max_n_day_precipitation_amount maximum {window}-day total precipitation
amount (rx{window}day)
max_pr_intensity Maximum precipitation intensity over rolling
{window}h time window
maximum_consecutive_warm_days Maximum number of consecutive days with
maximum daily temperature above {thresh}
mean_radiant_temperature Mean radiant temperature (mrt)
melt_and_precip_max Water equivalent maximum from precipitation
and snow melt ({freq}_melt_and_precip_max)
potential_evapotranspiration Potential evapotranspiration ("{method}"
method) (evspsblpot)
prcpavg Averaged precipitation
prcptot Total accumulated precipitation
prlp Liquid precipitation ("{method}" method with
temperature at or above {thresh})
prsn Solid precipitation ("{method}" method with
temperature at or below {thresh})
rain_frzgr Number of rain on frozen ground days (mean
daily temperature > 0℃ and precipitation >
{thresh})
rain_season Start of the rain season, End of the rain
season, Length of the rain season
(rain_season_start, rain_season_end,
rain_season_length)
rb_flashiness_index Richards-Baker Flashiness Index (rbi)
return_level N-year return level
(fa_{window}{mode:r}{indexer})
rprctot Proportion of accumulated precipitation
arising from convective processeswith
precipitation of at least {thresh}
rx1day Maximum 1-day total precipitation
sdii Average precipitation during days with daily
precipitation over {thresh} (Simple Daily
Intensity Index: SDII)
sea_ice_area Sum of ice-covered areas where sea ice
concentration exceeds {thresh}
sea_ice_extent Sum of ocean areas where sea ice
concentration exceeds {thresh}
sfcwind_max Maximum daily mean wind speed (sfcWind_max)
sfcwind_mean Mean daily mean wind speed (sfcWind_mean)
sfcwind_min Minimum daily mean wind speed (sfcWind_min)
sfcwindmax_max Maximum daily maximum wind speed
(sfcWindmax_max)
sfcwindmax_mean Mean daily maximum wind speed
(sfcWindmax_mean)
sfcwindmax_min Minimum daily maximum wind speed
(sfcWindmax_min)
shortwave_upwelling_radiation_from_net_downwelling
Upwelling shortwave flux (rsus)
snd_max_doy Day of the year when snow depth reaches its
maximum value ({freq}_snd_max_doy)
snd_season_end End date of continuous snow depth cover
snd_season_length Snow cover duration
snd_season_start Start date of continuous snow depth cover
snd_to_snw Approximation of daily snow amount from snow
depth and density (snw)
snow_depth Mean of daily snow depth
snow_melt_we_max Maximum snow melt ({freq}_snow_melt_we_max)
snowfall_frequency Percentage of days with snowfall above
{thresh} threshold
snowfall_intensity Mean daily snowfall above {thresh} threshold
snw_max Maximum snow amount equivalent
({freq}_snw_max)
snw_max_doy Day of year of maximum daily snow amount
equivalent ({freq}_snw_max_doy)
snw_season_end End date of continuous snow amount cover
snw_season_length Snow cover duration
snw_season_start Start date of continuous snow amount cover
snw_to_snd Approximation of daily snow depth from snow
amount and density (snd)
solidprcpavg Averaged solid precipitation
solidprcptot Total accumulated solid precipitation
spei Standardized precipitation
evapotranspiration index (SPEI)
spi Standardized Precipitation Index (SPI)
stats Daily statistics (stat_{indexer}{op:r})
tg Daily mean temperature
tg10p Number of days with mean temperature below
the 10th percentile
tg90p Number of days with mean temperature above
the 90th percentile
tg_days_above The number of days with mean temperature
above {thresh}
tg_days_below The number of days with mean temperature
below {thresh}
tg_max Maximum daily mean temperature
tg_mean Mean daily mean temperature
tg_min Minimum daily mean temperature
thawing_degree_days Cumulative sum of temperature degrees for
mean daily temperature above {thresh}
tn10p Number of days with minimum temperature
below the 10th percentile
tn90p Number of days with minimum temperature
above the 90th percentile
tn_days_above The number of days with minimum temperature
above {thresh}
tn_days_below The number of days with minimum temperature
below {thresh}
tn_max Maximum daily minimum temperature
tn_mean Mean daily minimum temperature
tn_min Minimum daily minimum temperature
tropical_nights Number of days with minimum daily
temperature above {thresh}
tx10p Number of days with maximum temperature
below the 10th percentile
tx90p Number of days with maximum temperature
above the 90th percentile
tx_days_above The number of days with maximum temperature
above {thresh}
tx_days_below The number of days with maximum temperature
below {thresh}
tx_max Maximum daily maximum temperature
tx_mean Mean daily maximum temperature
tx_min Minimum daily maximum temperature
tx_tn_days_above Number of days with daily minimum above
{thresh_tasmin} and daily maximum
temperatures above {thresh_tasmax}
usda_hardiness_zones Hardiness zones (hz)
utci Universal Thermal Climate Index (UTCI)
warm_and_dry_days Number of days where temperature is above
{tas_per_thresh}th percentile and
precipitation is below {pr_per_thresh}th
percentile
warm_and_wet_days Number of days where temperature above
{tas_per_thresh}th percentile and
precipitation above {pr_per_thresh}th
percentile
warm_spell_duration_index Number of days with at least {window}
consecutive days where the maximum daily
temperature is above the
{tasmax_per_thresh}th percentile(s)
water_budget Water budget
water_budget_from_tas Water budget ("{method}" method)
wet_prcptot Total accumulated precipitation over days
where precipitation exceeds {thresh}
wet_spell_frequency Number of wet periods of {window} day(s) or
more, during which the {op} precipitation on
a window of {window} day(s) is equal or over
{thresh}.
wet_spell_max_length Maximum consecutive number of days in a wet
period of {window} day(s) or more, during
which the {op} precipitation within windows
of {window} day(s) is equal or over
{thresh}.
wet_spell_total_length Number of days in wet periods of {window}
day(s) or more, during which the {op}
precipitation within windows of {window}
day(s) is equal or over {thresh}.
wetdays Number of days with daily precipitation at
or above {thresh}
wetdays_prop Proportion of days with precipitation at or
above {thresh}
wind_chill Wind chill factor
wind_speed_from_vector Near-surface wind speed, Near-surface wind
from direction (sfcWind, sfcWindfromdir)
wind_vector_from_speed Near-surface eastward wind, Near-surface
northward wind (uas, vas)
windy_days Number of days with surface wind speed at or
above {thresh}
winter_storm Days with snowfall at or above a given
threshold ({freq}_winter_storm)
xclim.sdba.measures.annual_cycle_correlation
Annual cycle correlation
(annual_cycle_correlation)
xclim.sdba.measures.bias Absolute bias (bias)
xclim.sdba.measures.circular_bias
Circular bias (circular_bias)
xclim.sdba.measures.mae Mean absolute error (mae)
xclim.sdba.measures.ratio Ratio (ratio)
xclim.sdba.measures.relative_bias
Relative bias (relative_bias)
xclim.sdba.measures.rmse Root mean square error (rmse)
xclim.sdba.measures.scorr Sum of the inter-site correlation
differences. (Scorr)
xclim.sdba.measures.taylordiagram
Standard deviations of sim, ref and
correlation coefficient between both.
(taylordiagram)
xclim.sdba.properties.acf Lag-{lag} autocorrelation of the variable
over a {group.prop} and averaged over all
years. (acf)
xclim.sdba.properties.annual_cycle_amplitude
{stat} of the annual cycle.
(annual_cycle_amplitude)
xclim.sdba.properties.annual_cycle_asymmetry
{stat} of the annual cycle.
(annual_cycle_asymmetry)
xclim.sdba.properties.annual_cycle_maximum
{stat} of the annual cycle.
(annual_cycle_maximum)
xclim.sdba.properties.annual_cycle_minimum
{stat} of the annual cycle.
(annual_cycle_minimum)
xclim.sdba.properties.annual_cycle_phase
{stat} of the annual cycle.
(annual_cycle_phase)
xclim.sdba.properties.corr_btw_var
{corr_type} correlation coefficient
(corr_btw_var)
xclim.sdba.properties.decorrelation_length
Decorrelation length. (decorrelation_length)
xclim.sdba.properties.first_eof
First empirical orthogonal function
(first_eof)
xclim.sdba.properties.mean Mean of the variable. (mean)
xclim.sdba.properties.mean_annual_phase
Average annual {stat}. (mean_annual_phase)
xclim.sdba.properties.mean_annual_range
Average annual {stat}. (mean_annual_range)
xclim.sdba.properties.mean_annual_relative_range
Average annual {stat}.
(mean_annual_relative_range)
xclim.sdba.properties.quantile Quantile {q} of the variable. (quantile)
xclim.sdba.properties.relative_annual_cycle_amplitude
{stat} of the annual cycle.
(relative_annual_cycle_amplitude)
xclim.sdba.properties.relative_frequency
Relative frequency of values {op} {thresh}.
(relative_frequency)
xclim.sdba.properties.return_value
{period}-{group.prop_name} {op} return level
of the variable. (return_value)
xclim.sdba.properties.skewness Skewness of the variable. (skewness)
xclim.sdba.properties.spatial_correlogram
Inter-site correlogram as a function of
distance. (spatial_correlogram)
xclim.sdba.properties.spell_length_distribution
{stat} of spell length distribution when the
variable is {op} the {method} {thresh}.
(spell_length_distribution)
xclim.sdba.properties.std Standard deviation of the variable. (std)
xclim.sdba.properties.transition_probability
Transition probability of values
{initial_op} {thresh} to values {final_op}
{thresh}. (transition_probability)
xclim.sdba.properties.trend {output} of the interannual linear trend.
(trend)
xclim.sdba.properties.var Variance of the variable. (var)
For more information about a specific indicator, you can either use the info sub-command or directly access the --help message of the indicator. The former gives more information about the metadata, while the latter only prints the usage. Note that the module name (atmos, land or seaIce) is mandatory.
[4]:
!xclim info liquidprcptot
Indicator liquidprcptot:
    identifier : liquidprcptot
    title : Total accumulated liquid precipitation.
    abstract : Total accumulated liquid precipitation. Precipitation
  is considered liquid when the average daily temperature is above a given
  threshold.
    keywords :
    outputs (#1)
      standard_name : lwe_thickness_of_liquid_precipitation_amount
      long_name : Total accumulated precipitation when temperature is
  above 0 degc
      units : mm
      cell_methods : time: sum over days
      description : Annual total liquid precipitation, estimated as
  precipitation when temperature is above 0 degc.
      var_name : liquidprcptot
    notes : Let :math:`PR_i` be the mean daily precipitation of day
  :math:`i`, then for a period :math:`j` starting at day :math:`a` and
  finishing on day :math:`b`:

  .. math::

     PR_{ij} = \sum_{i=a}^{b} PR_i

  If tas and phase are given, the corresponding phase precipitation is
  estimated before computing the accumulation, using one of
  `snowfall_approximation` or `rain_approximation` with the `binary` method.

Options:
  --pr VAR_NAME   Mean daily precipitation flux.  [default: pr]
  --tas VAR_NAME  Mean, maximum or minimum daily temperature.  [default: tas]
  --thresh TEXT   Threshold of `tas` over which the precipication is assumed
                  to be liquid rain.  [default: 0 degC]
  --freq TEXT     Resampling frequency.  [default: YS]
  --help          Show this message and exit.
In the usage message, VAR_NAME indicates that the passed argument must match a variable in the input dataset.
[5]:
from __future__ import annotations

import warnings
from pathlib import Path

import numpy as np
import pandas as pd
import xarray as xr
from pandas.plotting import register_matplotlib_converters

register_matplotlib_converters()
warnings.filterwarnings("ignore", "implicitly registered datetime converter")
%matplotlib inline
xr.set_options(display_style="html")


time = pd.date_range("2000-01-01", periods=366)
tasmin = xr.DataArray(
    -5 * np.cos(2 * np.pi * time.dayofyear / 365) + 273.15,
    dims="time",
    coords={"time": time},
    attrs={"units": "K"},
)
tasmax = xr.DataArray(
    -5 * np.cos(2 * np.pi * time.dayofyear / 365) + 283.15,
    dims="time",
    coords={"time": time},
    attrs={"units": "K"},
)
pr = xr.DataArray(
    np.clip(10 * np.sin(18 * np.pi * time.dayofyear / 365), 0, None),
    dims="time",
    coords={"time": time},
    attrs={"units": "mm/d"},
)
ds = xr.Dataset({"tasmin": tasmin, "tasmax": tasmax, "pr": pr})

data_folder = notebook_folder / "data"
data_folder.mkdir(exist_ok=True)
ds.to_netcdf(data_folder / "example_data.nc")
Computing indicators
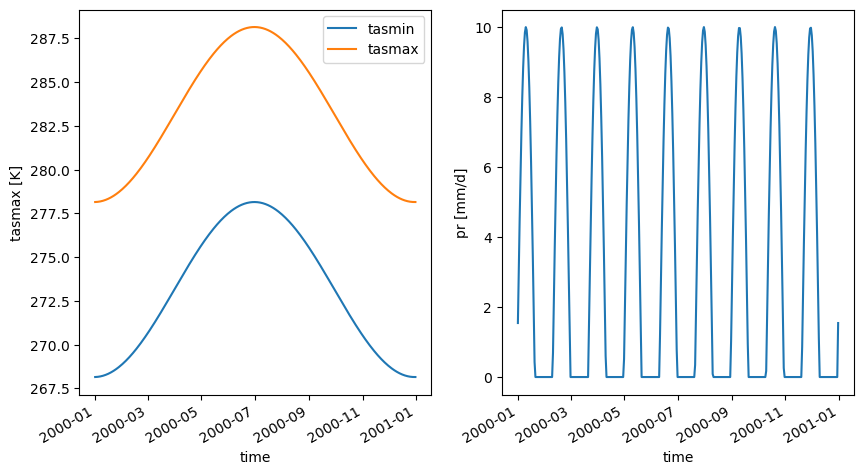
Let’s say we have the following toy dataset:
[6]:
import xarray as xr

ds = xr.open_dataset(data_folder.joinpath("example_data.nc"))
display(ds)
<xarray.Dataset>
Dimensions:  (time: 366)
Coordinates:
  * time     (time) datetime64[ns] 2000-01-01 2000-01-02 ... 2000-12-31
Data variables:
    tasmin   (time) float64 ...
    tasmax   (time) float64 ...
pr (time) float64 ...[7]:
import matplotlib.pyplot as plt

fig1, (ax_tas, ax_pr) = plt.subplots(1, 2, figsize=(10, 5))
ds.tasmin.plot(label="tasmin", ax=ax_tas)
ds.tasmax.plot(label="tasmax", ax=ax_tas)
ds.pr.plot(ax=ax_pr)
ax_tas.legend()
[7]:
<matplotlib.legend.Legend at 0x7f4a28aab390>
To compute an indicator, say the monthly solid precipitation accumulation, we simply call:
[8]:
!xclim -i data/example_data.nc -o data/out1.nc solidprcptot --pr pr --tas tasmin --freq MS
/home/docs/checkouts/readthedocs.org/user_builds/xclim/conda/v0.45.0/lib/python3.11/site-packages/xclim/core/cfchecks.py:41: UserWarning: Variable does not have a `cell_methods` attribute.
  _check_cell_methods(
/home/docs/checkouts/readthedocs.org/user_builds/xclim/conda/v0.45.0/lib/python3.11/site-packages/xclim/core/cfchecks.py:45: UserWarning: Variable does not have a `standard_name` attribute.
  check_valid(vardata, "standard_name", data["standard_name"])
/home/docs/checkouts/readthedocs.org/user_builds/xclim/conda/v0.45.0/lib/python3.11/site-packages/xclim/indicators/atmos/_precip.py:97: UserWarning: Variable does not have a `standard_name` attribute.
  cfchecks.check_valid(tas, "standard_name", "air_temperature")
[########################################] | 100% Completed | 100.84 ms
In this example, we decided to use tasmin for the tas variable. We didn’t need to provide the --pr parameter, as our data has the same name.
Finally, more than one indicator can be computed and written to the output dataset by simply chaining the calls:
[9]:
!xclim -i data/example_data.nc -o data/out2.nc liquidprcptot --tas tasmin --freq MS tropical_nights --thresh "2 degC" --freq MS
/home/docs/checkouts/readthedocs.org/user_builds/xclim/conda/v0.45.0/lib/python3.11/site-packages/xclim/core/cfchecks.py:41: UserWarning: Variable does not have a `cell_methods` attribute.
  _check_cell_methods(
/home/docs/checkouts/readthedocs.org/user_builds/xclim/conda/v0.45.0/lib/python3.11/site-packages/xclim/core/cfchecks.py:45: UserWarning: Variable does not have a `standard_name` attribute.
  check_valid(vardata, "standard_name", data["standard_name"])
/home/docs/checkouts/readthedocs.org/user_builds/xclim/conda/v0.45.0/lib/python3.11/site-packages/xclim/indicators/atmos/_precip.py:97: UserWarning: Variable does not have a `standard_name` attribute.
  cfchecks.check_valid(tas, "standard_name", "air_temperature")
/home/docs/checkouts/readthedocs.org/user_builds/xclim/conda/v0.45.0/lib/python3.11/site-packages/xclim/core/cfchecks.py:41: UserWarning: Variable does not have a `cell_methods` attribute.
  _check_cell_methods(
/home/docs/checkouts/readthedocs.org/user_builds/xclim/conda/v0.45.0/lib/python3.11/site-packages/xclim/core/cfchecks.py:45: UserWarning: Variable does not have a `standard_name` attribute.
  check_valid(vardata, "standard_name", data["standard_name"])
[########################################] | 100% Completed | 101.15 ms
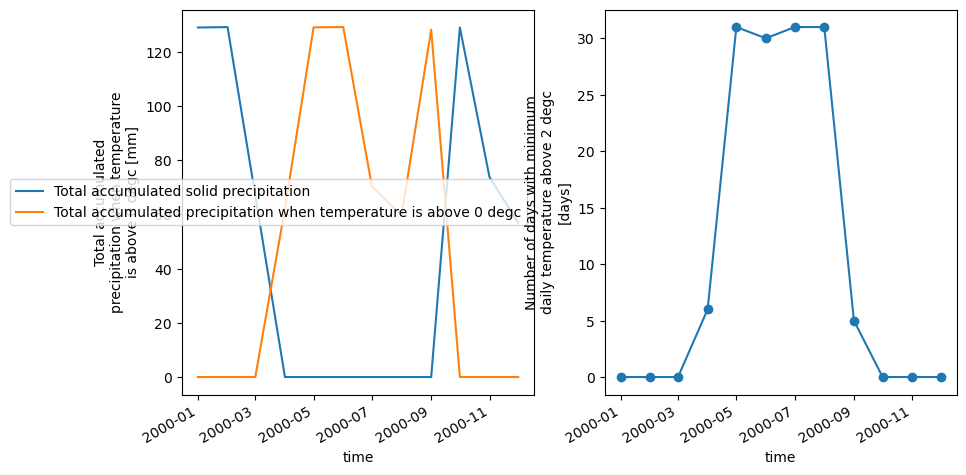
Let’s see the outputs:
[10]:
ds1 = xr.open_dataset(data_folder / "out1.nc")
ds2 = xr.open_dataset(data_folder / "out2.nc", decode_timedelta=False)

fig2, (ax_prcptot, ax_tropical_nights) = plt.subplots(1, 2, figsize=(10, 5))
ds1.solidprcptot.plot(ax=ax_prcptot, label=ds1.solidprcptot.long_name)
ds2.liquidprcptot.plot(ax=ax_prcptot, label=ds2.liquidprcptot.long_name)
ds2.tropical_nights.plot(ax=ax_tropical_nights, marker="o")
ax_prcptot.legend()
[10]:
<matplotlib.legend.Legend at 0x7f4a277f0250>
[11]:
ds1.close()
[12]:
ds2.close()
Data Quality Checks
As of version 0.30.0, xclim now also provides a command-line utility for performing data quality control checks on existing NetCDF files.
These checks examine the values of data_variables for suspicious value patterns (e.g. values that repeat for many days) or erroneous values (e.g. humidity percentages outside 0-100, minimum temperatures exceeding maximum temperatures, etc.). The checks (called dataflags) are based on the ECAD ICCLIM quality control checks (https://www.ecad.eu/documents/atbd.pdf).
The full list of checks performed for each variable are listed in xclim/core/data/variables.yml.
[13]:
!xclim dataflags --help
Usage: xclim dataflags [OPTIONS] [VARIABLES]...

  Run quality control checks on input data variables and flag for quality
  control issues or suspicious values.

Options:
  -r, --raise-flags  Print an exception in the event that a variable is found
                     to have quality control issues.
  -a, --append       Return the netCDF dataset with the `ecad_qc_flag` array
                     appended as a data_var.
  -d, --dims TEXT    Dimensions upon which aggregation should be performed.
                     Default: "all". Ignored if no variable provided.
  -f, --freq TEXT    Resampling periods frequency used for aggregation.
                     Default: None. Ignored if no variable provided.
  --help             Show this message and exit.
When running the dataflags CLI checks, you must either set an output file (-o filename.nc) or set the checks to raise if there are any failed checks (-r).
By default, when setting an output file, the returned file will only contain the flag value (True if no flags were raised, False otherwise). To append the flag to a copy of the dataset, we use the -a option.
The default behaviour is to raise a flag if any element of the array resolves to True (i.e. aggregated across all dimensions), but we can specify the level of aggregation by dimension with the -d or --dims option.
[14]:
# Create an output file with just the flag value and no aggregation (dims=None)

!xclim -i data/example_data.nc -o data/flag_output.nc dataflags -d none

# Need to wait until the file is written

!sleep 2s
[########################################] | 100% Completed | 101.79 ms
[15]:
import xarray as xr

ds1 = xr.open_dataset(data_folder / "flag_output.nc")
display(ds1.data_vars, ds1.ecad_qc_flag)
ds1.close()
Data variables:
    ecad_qc_flag  (time) bool ...
<xarray.DataArray 'ecad_qc_flag' (time: 366)>
[366 values with dtype=bool]
Coordinates:
  * time     (time) datetime64[ns] 2000-01-01 2000-01-02 ... 2000-12-31
Attributes:
    comment:  Adheres to ECAD quality control checks.
history: [2023-09-07 14:54:46] - xclim version: 0.45.0 - Performed the f...[16]:
# Create an output file with values appended to the original dataset.

!xclim -i data/example_data.nc -o data/flag_output_appended.nc dataflags -a

# Need to wait until the file is written
!sleep 2s
[########################################] | 100% Completed | 101.66 ms
[17]:
import xarray as xr

ds2 = xr.open_dataset(data_folder / "flag_output_appended.nc")
display(ds2.data_vars, ds2.ecad_qc_flag)
ds2.close()
Data variables:
    tasmin        (time) float64 ...
    tasmax        (time) float64 ...
    pr            (time) float64 ...
    ecad_qc_flag  bool ...
<xarray.DataArray 'ecad_qc_flag' ()>
[1 values with dtype=bool]
Attributes:
    comment:  Adheres to ECAD quality control checks.
history: [2023-09-07 14:54:55] - xclim version: 0.45.0 - Performed the f...[18]:
# Raise an error if any quality control checks fail. Passing example:

!xclim -i data/example_data.nc dataflags -r
Dataset passes quality control checks!
[19]:
import xarray as xr

# Create some bad data with minimum temperatures exceeding max temperatures
bad_ds = xr.open_dataset(data_folder / "example_data.nc")

# Swap entire variable arrays
bad_ds["tasmin"].values, bad_ds["tasmax"].values = (
    bad_ds.tasmax.values,
    bad_ds.tasmin.values,
)
bad_ds.to_netcdf(data_folder / "suspicious_data.nc")
bad_ds.close()
[20]:
# Raise an error if any quality control checks fail. Failing example:

!xclim -i data/suspicious_data.nc dataflags -r
Data quality flags indicate suspicious values. Flags raised are:
  - Maximum temperature values found below minimum temperatures.
  - Maximum temperature values found below minimum temperatures.
These checks can also be set to examine a specific variable within a NetCDF file, with more descriptive information for each check performed.
[21]:
!xclim -i data/example_data.nc -o data/flag_output_pr.nc dataflags pr
[########################################] | 100% Completed | 1.61 s
[22]:
import xarray as xr

ds3 = xr.open_dataset(data_folder / "flag_output_pr.nc")
display(ds3.data_vars)
for dv in ds3.data_vars:
    display(ds3[dv])
Data variables:
    negative_accumulation_values               bool ...
    very_large_precipitation_events            bool ...
    values_eq_5_repeating_for_5_or_more_days   bool ...
    values_eq_1_repeating_for_10_or_more_days  bool ...
<xarray.DataArray 'negative_accumulation_values' ()>
[1 values with dtype=bool]
Attributes:
    description:  Negative values found for pr.
    units:
history: [2023-09-07 14:55:16] pr: negative_accumulation_values(da=p...<xarray.DataArray 'very_large_precipitation_events' ()>
[1 values with dtype=bool]
Attributes:
description: Precipitation events in excess of 300 mm d-1 for pr.
units:
history: [2023-09-07 14:55:16] pr: very_large_precipitation_events(d...<xarray.DataArray 'values_eq_5_repeating_for_5_or_more_days' ()>
[1 values with dtype=bool]
Attributes:
description: Repetitive values at 5.0 for at least 5 days found for pr.
units:
history: [2023-09-07 14:55:16] pr: values_op_thresh_repeating_for_n_...<xarray.DataArray 'values_eq_1_repeating_for_10_or_more_days' ()>
[1 values with dtype=bool]
Attributes:
description: Repetitive values at 1.0 for at least 10 days found for pr.
units:
history: [2023-09-07 14:55:16] pr: values_op_thresh_repeating_for_n_...