Download this notebook from github.
Unit handling
[1]:
import xarray as xr

import xclim as xc

# Set display to HTML style (optional)
xr.set_options(display_style="html", display_width=50)

# import plotting stuff
import matplotlib.pyplot as plt

%matplotlib inline
plt.style.use("seaborn")
plt.rcParams["figure.figsize"] = (11, 5)
A lot of effort has been placed into automatic handling of input data units. xclim will automatically detect the input variable(s) units (e.g. °C versus °K or mm/s versus mm/day etc.) and adjust on-the-fly in order to calculate indices in the consistent manner. This comes with the obvious caveat that input data requires metadata attribute for units
For precipitation data, xclim expects precipitation fluxes. This could be units of length/time, such as mm/d, or units of mass / area / time, such as kg/m²/s. Units of length only, such as mm, are not supported, because the interpretation depends on the frequency of the data, which cannot always be inferred explicitly from the data. For example, if a daily precipitation series records total daily precipitation and has units of mm, change the units attribute to mm/d before
computing indicators. Note that xclim will automatically convert between mass / area / time and length/time using a water density of 1000 kg/m³ when the context is hydrology.
In the following examples, our toy temperature dataset comes in units of Kelvins ("degK").
[2]:
# See the Usage page for details on opening datasets, subsetting and resampling.
ds = xr.tutorial.open_dataset("air_temperature")
tas = (
    ds.air.sel(lat=40, lon=270, method="nearest")
    .resample(time="D")
    .mean(keep_attrs=True)
)
print(tas.attrs["units"])
degK
Using pint, xclim provides useful functions to convert the units of datasets and DataArrays. Here, we convert our kelvin data to the very useful Fahrenheits:
[3]:
tas_F = xc.units.convert_units_to(tas, "degF")
print(tas_F.attrs["units"])
°F
Threshold indices
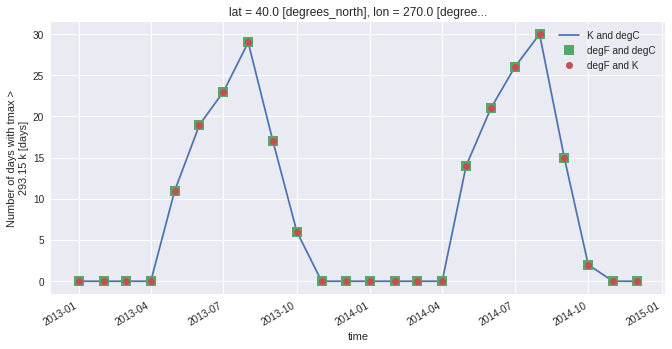
xclim unit handling also applies to threshold indicators. Users can provide threshold in units of choice and xclim will adjust automatically. For example determining the number of days with tasmax > 20°C users can define a threshold input of ‘20 C’ or ‘20 degC’ even if input data is in Kelvin. Alernatively users can even provide a threshold in Kelvin ‘293.15 K’ (if they really wanted to).
[4]:
with xc.set_options(cf_compliance="log"):
    # Using Kelvin data, threshold in Celsius
    out1 = xc.atmos.tx_days_above(tasmax=tas, thresh="20 C", freq="MS")

    # Using Fahrenheit data, threshold in Celsius
    out2 = xc.atmos.tx_days_above(tasmax=tas_F, thresh="20 C", freq="MS")

    # Using Fahrenheit data, with threshold in Kelvin
    out3 = xc.atmos.tx_days_above(tasmax=tas_F, thresh="293.15 K", freq="MS")

# Plot and see that it's all identical:
plt.figure()
out1.plot(label="K and degC", linestyle="-")
out2.plot(label="degF and degC", marker="s", markersize=10, linestyle="none")
out3.plot(label="degF and K", marker="o", linestyle="none")
plt.legend()
[4]:
<matplotlib.legend.Legend at 0x7fec6be7ba00>
Sum and count indices
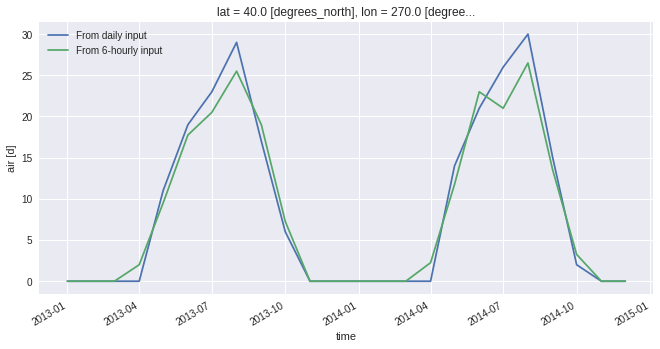
Many indices in xclim will either sum values or count events along the time dimension and over a period. As of version 0.24, unit handling dynamically infers what the sampling frequency and its corresponding unit is.
Indicators, on the other hand, do not have this flexibility and often expect input at a given frequency, more often daily then otherwise.
For example, we can run the tx_days_above on the 6-hourly test data and it should return similar results as on the daily data, but in units of h (the base unit of the sampling frequency).
[5]:
tas_6h = ds.air.sel(
    lat=40, lon=270, method="nearest"
)  # no resampling, original data is 6-hourly
out4_h = xc.indices.tx_days_above(tasmax=tas_6h, thresh="20 C", freq="MS")
out4_h
[5]:
<xarray.DataArray 'air' (time: 24)>
array([  0,   0,   0,  48, 228, 426, 492, 612, 456, 174,   0,   0,   0,
         0,   0,  54, 282, 552, 504, 636, 324,  78,   0,   0])
Coordinates:
  * time     (time) datetime64[ns] 2013-01-01 ....
    lat      float32 40.0
    lon      float32 270.0
Attributes:
units: hr[6]:
out4_d = xc.units.convert_units_to(out4_h, "d")
plt.figure()
out1.plot(label="From daily input", linestyle="-")
out4_d.plot(label="From 6-hourly input", linestyle="-")
plt.legend()
[6]:
<matplotlib.legend.Legend at 0x7fec72a34c70>
Other utilites
Many helper functions are defined in xclim.core.units, see Unit handling module.