Download this notebook from github.
Extending xclim
xclim tries to make it easy for users to add their own indicators. The following goes into details on how to create compute functions and document them so that xclim can parse most of the metadata directly. We then explain the multiple ways new Indicators can be created and how we can regroup and structure them in virtual submodules.
Central to xclim are the Indicators, objects computing some statistic or function over climate variables, but xclim also provides many other modules:
This introduction will focus on the Indicator part of xclim and how one can extend it by implementing new ones.
Indicators and compute functions
Internally and in the documentation, xclim makes a distinction between “indicators” and their compute functions.
index-like compute function
A python function accepting DataArrays and other parameters (usually built-in types)
Returns one or several DataArrays.
Handles the units : checks input units and set proper CF-compliant output units. But doesn’t usually prescribe specific units, the output will at minimum have the proper dimensionality.
Performs no other checks or set any (non-unit) metadata.
May have a documentation following a certain template so that parsing it is easier
Accessible through xclim.compute.
indicator
An instance of a subclass of
xclim.core.indicator.Indicatorthat wraps around the previous index-like compute function (stored in itscomputeproperty).Returns one or several DataArrays, or a Dataset, according to the
as_datasetglobal option (see xclim.set_options).Handles missing values, performs input data checks and metadata checks (see usage).
Always outputs data in the same units.
Adds (dynamically generated) metadata to the output after computation.
Accessible through xclim.indicators.
Most metadata stored in the Indicators is parsed from the underlying index documentation, so defining indices with complete documentation and an appropriate signature helps the process. The two next sections go into details on the definition of both objects.
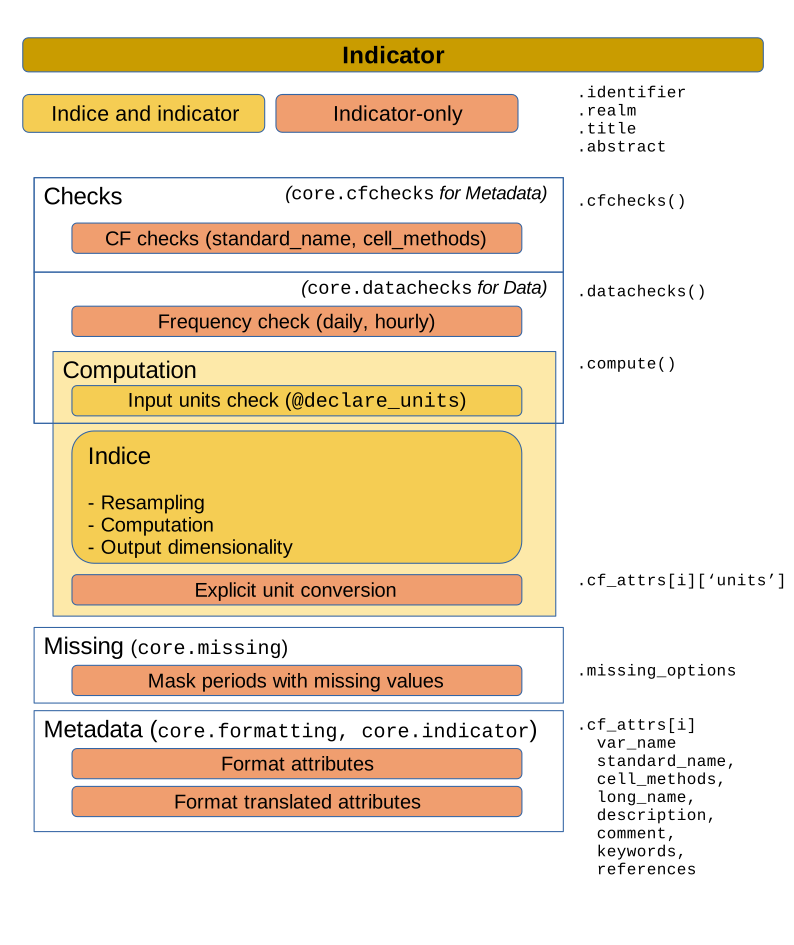
Call sequence
The following graph shows the steps done when calling an Indicator. Attributes and methods of the Indicator object relating to those steps are listed on the right side.
Defining new index-like compute functions
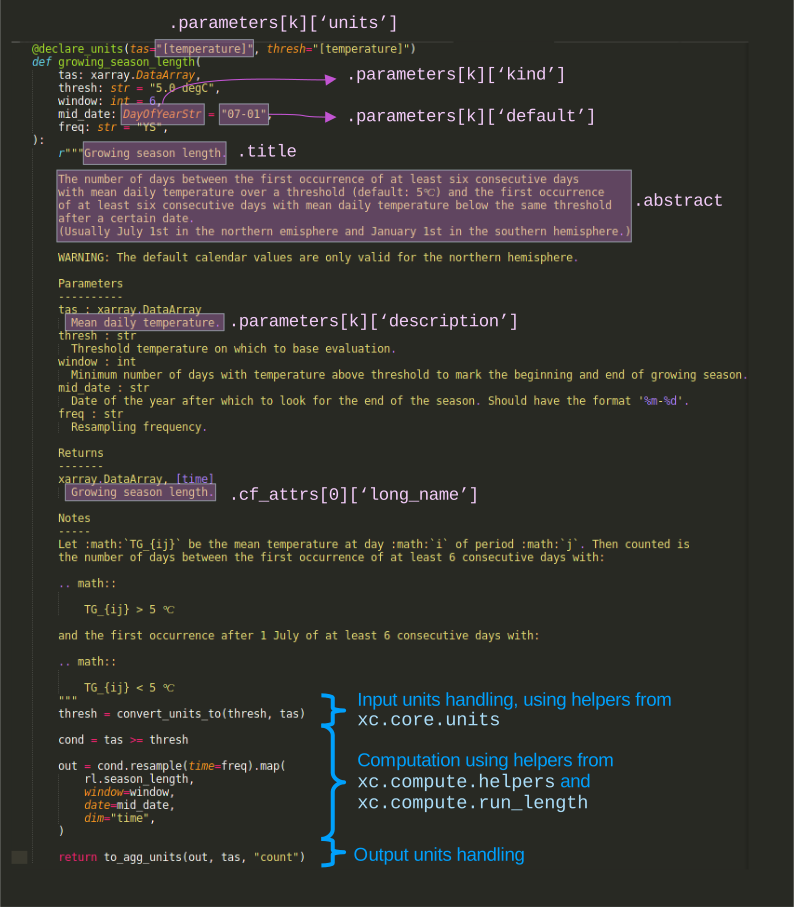
The annotated example below shows the general template to be followed when defining a compute function to be wrapped by the Indicator class. The target attributes of the indicator instance that would be created from this function are added to the figure for reference.
Note that these standards are not all required. Problems in parsing will not raise errors at runtime, but might raise warnings and will result in Indicators with poorer metadata than expected by most users, especially those that dynamically use them in other applications where the code is inaccessible, like web services.
The following code is another example.
[ ]:
import xarray as xr
from IPython.display import Code, display

import xclim
from xclim.compute.generic import count_occurrences
from xclim.core import Condition, Freq, Quantified
from xclim.core.units import convert_units_to, declare_units, to_agg_units


@declare_units(tasmax="[temperature]", thresh="[temperature]")
def tx_days_compare(tasmax: xr.DataArray, thresh: Quantified = "0 degC", condition: Condition = ">", freq: Freq = "YS"):
    r"""
    Number of days where maximum daily temperature is above or under a threshold.

    The daily maximum temperature is compared to a threshold using a given operator and the number
    of days where the condition is true is returned.

    It assumes a daily input.

    Parameters
    ----------
    tasmax : xarray.DataArray
        Maximum daily temperature.
    thresh : str
        Threshold temperature to compare to.
    condition : {'>', '<'}
        The condition to verify.
        # A fixed set of choices can be imposed. Only strings, numbers, booleans or None are accepted.
    freq : str
        Resampling frequency.

    Returns
    -------
    xarray.DataArray, [temperature]
        Maximum value of daily maximum temperature.

    Notes
    -----
    Let :math:`TX_{ij}` be the maximum temperature at day :math:`i` of period :math:`j`. Then the maximum
    daily maximum temperature for period :math:`j` is:

    .. math::

        TXx_j = max(TX_{ij})

    References
    ----------
    :cite:cts:`smith_citation_2020`
    """
    thresh = convert_units_to(thresh, tasmax)
    out = count_occurrences(tasmax, condition, thresh, freq)
    return to_agg_units(out, tasmax, "count")
Naming and conventions
Variable names should correspond to CMIP6 variables or CMIP7 physical parameters, whenever possible. The file xclim/data/variables.yml lists all variables that xclim can use when generating indicators.
Annotations
The example above makes use of Typing vars from xclim.core to annotate the signature of the function. This is recommended, while not necessary. It helps the Indicator wrap the function with more meaningful metadata.
Generic functions for common operations
The xclim.compute.generic submodule contains generic index-like functions for common computations (like count_occurrences or statistics), inspired by clix-meta. In order to reduce duplicate code, their use is recommended when possible inside xclim. As previously said, the units handling has to be made explicitly when non-trivial, xclim.core.units also exposes a
few helpers for that (like convert_units_to, to_agg_units or rate2amount).
Documentation
As shown in both example, a certain level of convention is best followed when writing the docstring of the index function. The general structure follows the NumpyDoc conventions, and some fields might be parsed when creating the indicator (see the image above and the section below). If you are contributing to the xclim codebase, when adding a citation to the docstring, this is best done by adding that reference to the references.bib file and then citing it using its label with the
:cite:cts: directive (or one of its variant). See the contributing docs.
Defining new indicators
xclim’s Indicators are instances of (subclasses of) xclim.core.indicator.Indicator. While they are the central to xclim, their construction can be somewhat tricky as a lot happens backstage. Essentially, they act as self-aware functions, taking a set of input variables (DataArrays) and parameters (usually strings, integers or floats), performing some health checks on them and returning one or multiple DataArrays, with CF-compliant (and potentially translated) metadata attributes, masked
according to a given missing value set of rules. They define the following key attributes:
the
identifier, as string that uniquely identifies the indicator, usually all caps.the
realm, one of “atmos”, “land”, “seaIce” or “ocean”, classifying the domain of use of the indicator.the
computefunction that returns one or more DataArrays, the “index”,the
cfcheckanddatacheckmethods that make sure the inputs are appropriate and valid.the
missingfunction that masks elements based on null values in the input.all metadata attributes that will be attributed to the output and that document the indicator:
Indicator-level attribute are :
title,abstract,keywords,referencesandnotes.Output variables attributes (respecting CF conventions) are:
var_name,standard_name,long_name,units,cell_methods,descriptionandcomment.
Output variables attributes are regrouped in Indicator.cf_attrs and input parameters are documented in Indicator.parameters.
A particularity of Indicators is that each instance corresponds to a single class: when creating a new indicator, a new class is automatically created. This is done for easy construction of indicators based on others, like shown further down.
See the class documentation for more info on the meaning of each attribute. The indicators module contains over 50 examples of indicators to draw inspiration from.
Identifier vs python name
An indicator’s identifier is not the same as the name it has within the python module. For example, xclim.atmos.relative_humidity has hurs as its identifier. As explained below, indicator classes can be accessed through xclim.core.indicator.registry with their identifier.
Metadata parsing vs explicit setting
As explained above, most metadata can be parsed from the index’s signature and docstring. Otherwise, it can always be set when creating a new Indicator instance or a new subclass. When creating an indicator, output metadata attributes can be given as strings, or list of strings in the case of an indicator returning multiple outputs. However, they are stored in the cf_attrs list of dictionaries on the instance.
Internationalization of metadata
xclim offers the possibility to translate the main Indicator metadata field and can automatically add the translations to the outputs. The mechanism is explained in the Internationalization page. French translation is usually already available for built-in indicators.
Inputs and checks
xclim decides which input arguments of the indicator’s call function are considered variables and which are parameters using the annotations of the underlying index (the compute method). Arguments annotated with the xarray.DataArray type are considered variables and can be read from the dataset passed in ds.
Indicator creation
There are three ways of creating indicators:
By initializing an existing indicator (sub)class
From a dictionary
From a Yaml file (which is very similar to the dictionary method)
The first method is best when defining indicators in scripts or external modules and is explained here. The last is best used when building “virtual modules” and is explained further down and in the submodule doc.
Creating a new indicator that simply modifies some metadata output of an existing one is a simple call like:
[ ]:
from xclim.core.indicator import registry

# An indicator based on tg_mean, but returning Celsius and fixed on annual resampling
tg_mean_c = registry["TG_MEAN"](
    identifier="tg_mean_c",
    units="degC",
    title="Mean daily mean temperature but in degC",
    parameters=dict(freq="YS"),  # We inject the freq arg.
)
[ ]:
display(Code(tg_mean_c.__doc__, language="rst"))
The registry is a dictionary mapping indicator identifiers (in uppercase) to their class. This way, we could subclass tg_mean to create our new indicator. tg_mean_c is the exact same as atmos.tg_mean, but outputs the result in Celsius instead of Kelvins, has a different title and removes control over the freq argument, resampling to “YS”. The identifier keyword is here needed in order to differentiate the new indicator from tg_mean itself. If it wasn’t given, a warning
would have been raised and further subclassing of tg_mean would have in fact subclassed tg_mean_c, which is not wanted!
By default, indicator classes are registered in xclim.core.indicator.registry, using their identifier, which is prepended by the indicator’s module if that indicator is declared outside xclim. A “child” indicator inherits its module from its parent:
[ ]:
tg_mean_c.__module__ == xclim.atmos.tg_mean.__module__
To create indicators with a different module, for example, in a goal to differentiate them in the registry, two methods can be used : passing module to the constructor, or using conventional class inheritance.
[ ]:
# Passing module
tg_mean_c2 = registry["TG_MEAN_C"](module="test")  # we didn't change the identifier!
print(tg_mean_c2.__module__)
"test.TG_MEAN_C" in registry
[ ]:
# Conventional class inheritance, uses the current module name


class TG_MEAN_C3(registry["TG_MEAN_C"]):  # noqa
    pass  # nothing to change really


tg_mean_c3 = TG_MEAN_C3()

print(tg_mean_c3.__module__)
"__main__.TG_MEAN_C" in registry
While the former method is shorter, the latter is what xclim uses internally, as it provides some clean code structure. See the code in the GitHub repo.
Virtual modules
xclim gives users the ability to generate their own modules. These mappings can help in emulating existing libraries (such as icclim), with the added benefit of CF-compliant metadata, multilingual metadata support, and optimized calculations using federated resources (using Dask). This can be used for example to tailor existing indicators with predefined thresholds without having to rewrite them.
Presently, xclim is capable of approximating the indicators developed in icclim, ANUCLIM and clix-meta and is open to contributions of new indicators and library mappings.
This notebook serves as an example of how one might go about creating their own library of mapped indicators. Two ways are possible:
From a YAML file (recommended way)
From a mapping (dictionary) of indicators
YAML file
The first method is based on the YAML syntax proposed by clix-meta, expanded to xclim’s needs. The full documentation on that syntax is here. This notebook shows an example of different complexities of indicator creation. It creates a minimal python module defining an index, creates a YAML file with the metadata for several indicators and then parses it into xclim.
[ ]:
# These variables were generated by a hidden cell above that syntax-colored them.
print("Content of example.py :")
display(Code(pydata, language="python"))
print("\n\nContent of example.yml :")
display(Code(ymldata, language="yaml"))
print("\n\nContent of example.fr.json :")
display(Code(jsondata, language="json"))
example.yml created a module of 7 indicators.
Values of the base arguments are the identifier of the associated indicators, and those can be different from their name within the Python modules. For example, xclim.atmos.relative_humidity has HURS as identifier. One can always access xclim.atmos.relative_humidity.identifier to get the correct name to use. The base argument also accepts generic base classes which are registered in xc.core.indicator.base_registry.
RX1dayis asregistry['RX1DAY'], but with an updatedlong_nameand an injected argument : itsindexerarg is now set to only compute over may to september.RX5day_canopyis based onregistry['MAX_N_DAY_PRECIPITATION_AMOUNT'], changed thelong_nameand injects thewindowandfreqarguments.It also requests a different variable than the original indicator :
prveginstead ofpr. As xclim doesn’t know aboutprveg, a definition is given in thevariablessection.
R75pdaysis based onregistry['DAYS_OVER_PRECIP_THRESH'], injects thethreshargument and changes the description of theperargument.first_frost_dayis a more complex example. As there were nobase:entry, theDailyclass serves as a base by default. This class doesn’t do much, so a lot has to be given explicitly:A compute function name if given. Here it refers a “generic” function (in
xclim.compute.generic), which means it doesn’t provide any pertinent metadata, but it handles the units.Thus, output metadata fields are given
Some parameters are injected (they will not appear on the indicator’s signature), the default for
freqis modified, but left as an argument.The input variable
datais mapped to a known variable. “Generic” functions need to be told what units to expect, so we tell xclim that thedataargument is minimum daily temperature. This will activate the proper units check and CF-compliance checks within the indicator class.
R95pis similar tofirst_frost_daybut here thecomputeis not defined inxclimbut rather inexample.py. Also, the custom function returns two outputs, so theoutputsection is a list of mappings rather than a mapping directly.R99pis the same asR95pbut changes the injected value. In order to avoid rewriting the output metadata, and allowed periods, we based it onR95p: as the latter was defined within the current YAML file, the identifier is prefixed by a dot (.).
Additionally, the YAML specified a realm and references to be used on all indices and provided a submodule docstring.
Finally, French translations for the main attributes and the new indicators are given in example.fr.json. Even though new indicator objects are created for each YAML entry, non-specified translations are taken from the base classes if missing in the JSON file.
Note that all files are named the same way : example.<ext>, with the translations having an additional suffix giving the locale name. In the next cell, we build the module by passing only the path without extension. This absence of extension is what tells xclim to try to parse a module (*.py) and custom translations (*.<locale>.json). Those two could also be read beforehand and passed through the indices= and translations= arguments.
Validation of the YAML file
Using yamale, it is possible to check if the YAML file is valid. xclim ships with a schema (in xclim/data/schema.yml) file.
The validation can be executed in a python session:
[ ]:
from importlib.resources import files

import yamale

data = files("xclim.data").joinpath("schema.yml")
schema = yamale.make_schema(data)

example_module = yamale.make_data(example_dir / "example.yml")  # in the example folder

yamale.validate(schema, example_module)
Or the validation can alternatively be run from the command line with:
yamale -s path/to/schema.yml path/to/module.yml
Note that xclim builds indicators from a yaml file, as shown in the next example, it validates it first.
Loading the module and computing indicators.
[ ]:
import xclim as xc

example = xc.core.indicator.build_indicator_module_from_yaml(example_dir / "example", mode="raise")
[ ]:
docstring = f"{example.__doc__}\n---\n\n{xc.indicators.example.R99p.__doc__}"
display(Code(docstring, language="rst"))
Useful for using this technique in large projects, we can iterate over the indicators like so:
[ ]:
from xclim.testing import open_dataset

ds = open_dataset("ERA5/daily_surface_cancities_1990-1993.nc")
with xr.set_options(keep_attrs=True):
    ds2 = ds.assign(
        pr_per=xc.core.calendar.percentile_doy(ds.pr, window=5, per=75).isel(percentiles=0),
        prveg=ds.pr * 1.1,  # Very realistic
    )
    ds2.prveg.attrs["standard_name"] = "precipitation_flux_onto_canopy"

outs = []
with xc.set_options(metadata_locales="fr", as_dataset=True):
    inds = ["Indicators:"]
    for name, ind in example.iter_indicators():
        print(f"computing {name}")
        out = ind(ds=ds2)  # Use all default arguments and variables from the dataset
        outs.append(out)
out contains all the computed data, with translated metadata. Note that this merge doesn’t make much sense with the current list of indicators since they have different frequencies (freq).
[ ]:
out = xr.merge(outs, join="outer", compat="override")
out.attrs = {
    "title": "Indicators computed from the example module."
}  # Merge puts the attributes of the first variable, we don't want that.
out
Mapping of indicators
For more complex mappings, submodules can be constructed from Indicators directly. This is not the recommended way, but can sometimes be a workaround when the YAML version is lacking features.
[ ]:
from xclim.core.indicator import build_indicator_module, registry

mapping = dict(
    egg_cooking_season=registry["MAXIMUM_CONSECUTIVE_WARM_DAYS"](
        module="awesome",
        compute=xc.compute.generic.spell_length_statistics,
        parameters=dict(
            thresh="35 degC",
            window=1,
            window_statistic="min",
            condition=">",
            statistic="max",
            min_gap=1,
            constrain=None,
            freq="YS",
        ),
        long_name="Season for outdoor egg cooking.",
    ),
    fish_feeling_days=registry["WETDAYS"](
        module="awesome",
        compute=xc.compute.generic.count_occurrences,
        parameters=dict(thresh="14.0 mm/day", condition=">=", constrain=None, freq="YS"),
        long_name="Days where we feel we are fishes",
    ),
    sweater_weather=xc.atmos.tg_min.__class__(module="awesome"),
)

awesome = build_indicator_module(
    name="awesome",
    objs=mapping,
    doc="""
        ============================
        My Awesome Custom indicators
        ============================
        There are only 3 indicators that really matter when you come down to brass tacks.
        This mapping library exposes them to users who want to perform real deal
        climate science.
        """,
)
[ ]:
print(xc.indicators.awesome.__doc__)
[ ]: